Beeism
Year
'21
Client
Graduate Project
Service
Data Visualisation
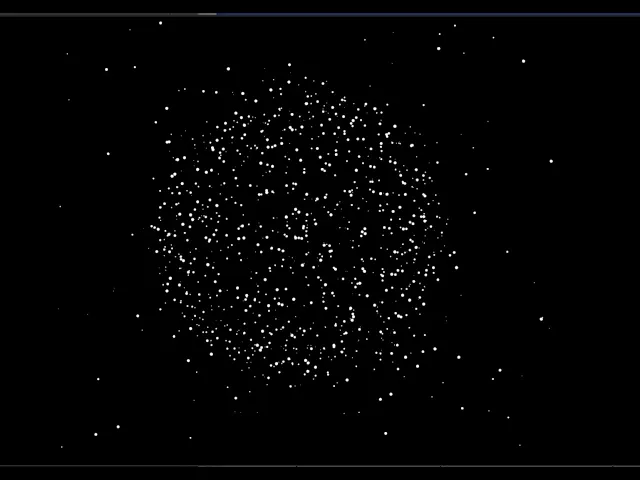
This project combines data visualization with creative coding. Using processing and Javascript libraries, beehive activity during different periods in the year in areas of Pennsylvania was visualized.

Process
For this project, data was sourced from the Center of Pollinator Research, Penn State University [Funding by a USDA-NIFA-AFRI (#2018-67013-27538) to C.M. Grozinger.] Parsing through this data, information related to specific hives could be categorized to study the trend of weight changes in bee hives through the year. Data collected between June 14th, 2018 to November 28th, 2018 was used.
After curating the data, hive activity was visualized with a P5.js particle system to reflect how individual element

Final Prototypes

Bloom
Project Overview
Functioning as a “super organism”, a honey bee colony can contain thousands of individuals whose intricate behavior results from a shared genetic background and sophisticated social signals.
With the catastrophic effects of climate change looming closer, it becomes essential to visualize the unique processes of the natural environment to understand the needs of this complex ecosystem.
Inferences
With the catastrophic effects of climate change looming closer, it becomes essential to visualize the unique processes of the natural environment to understand the needs of this complex ecosystem.