Loneliness
Year
21-22'

Client
Graduate Thesis
Service
Experience Design
This was my MFA graduation thesis in Graphic Design at Penn State University. It explores mental health through strategic, scientific conversations, using data-driven storytelling and new media. This project enhanced my skills in interactive storytelling and systems design.
This was my MFA graduation thesis in Graphic Design at Penn State University. It explores mental health through strategic, scientific conversations, using data-driven storytelling and new media. This project enhanced my skills in interactive storytelling and systems design.
This was my MFA graduation thesis in Graphic Design at Penn State University. It explores mental health through strategic, scientific conversations, using data-driven storytelling and new media. This project enhanced my skills in interactive storytelling and systems design.

Process
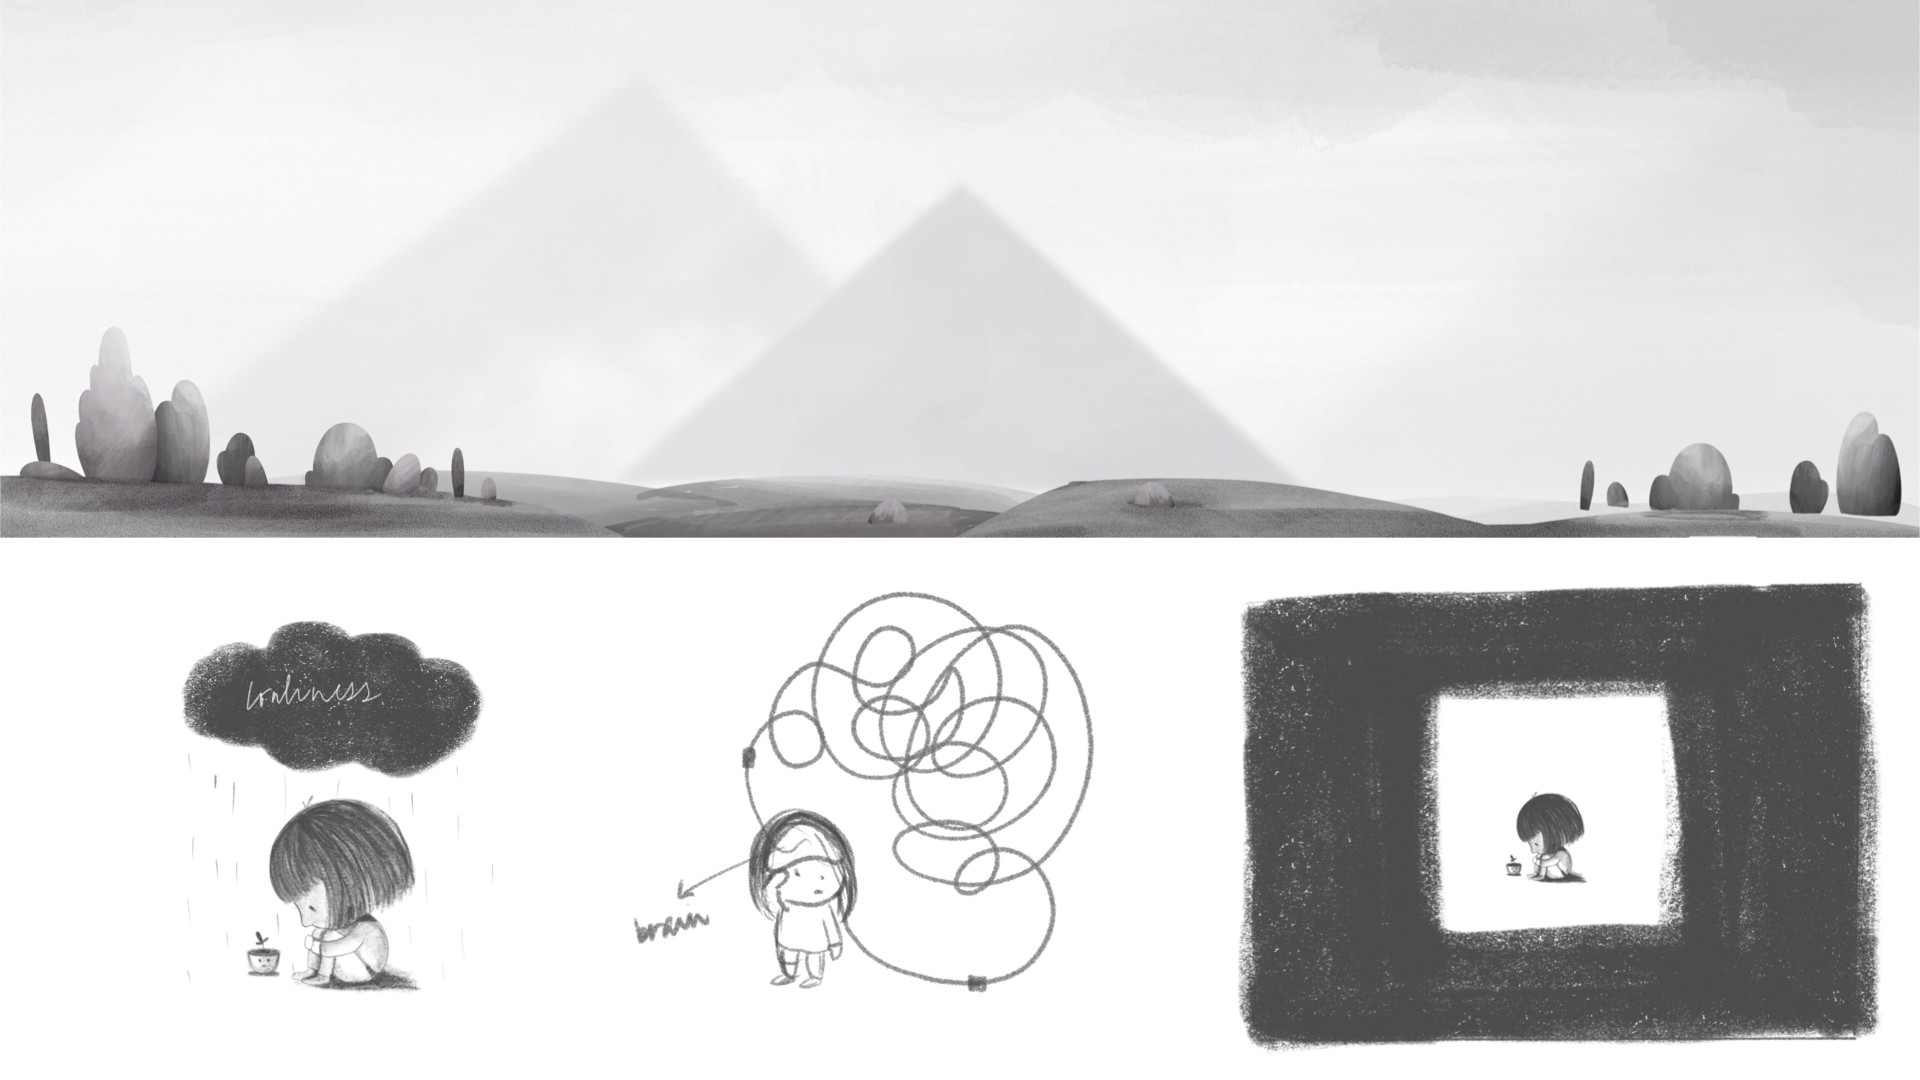
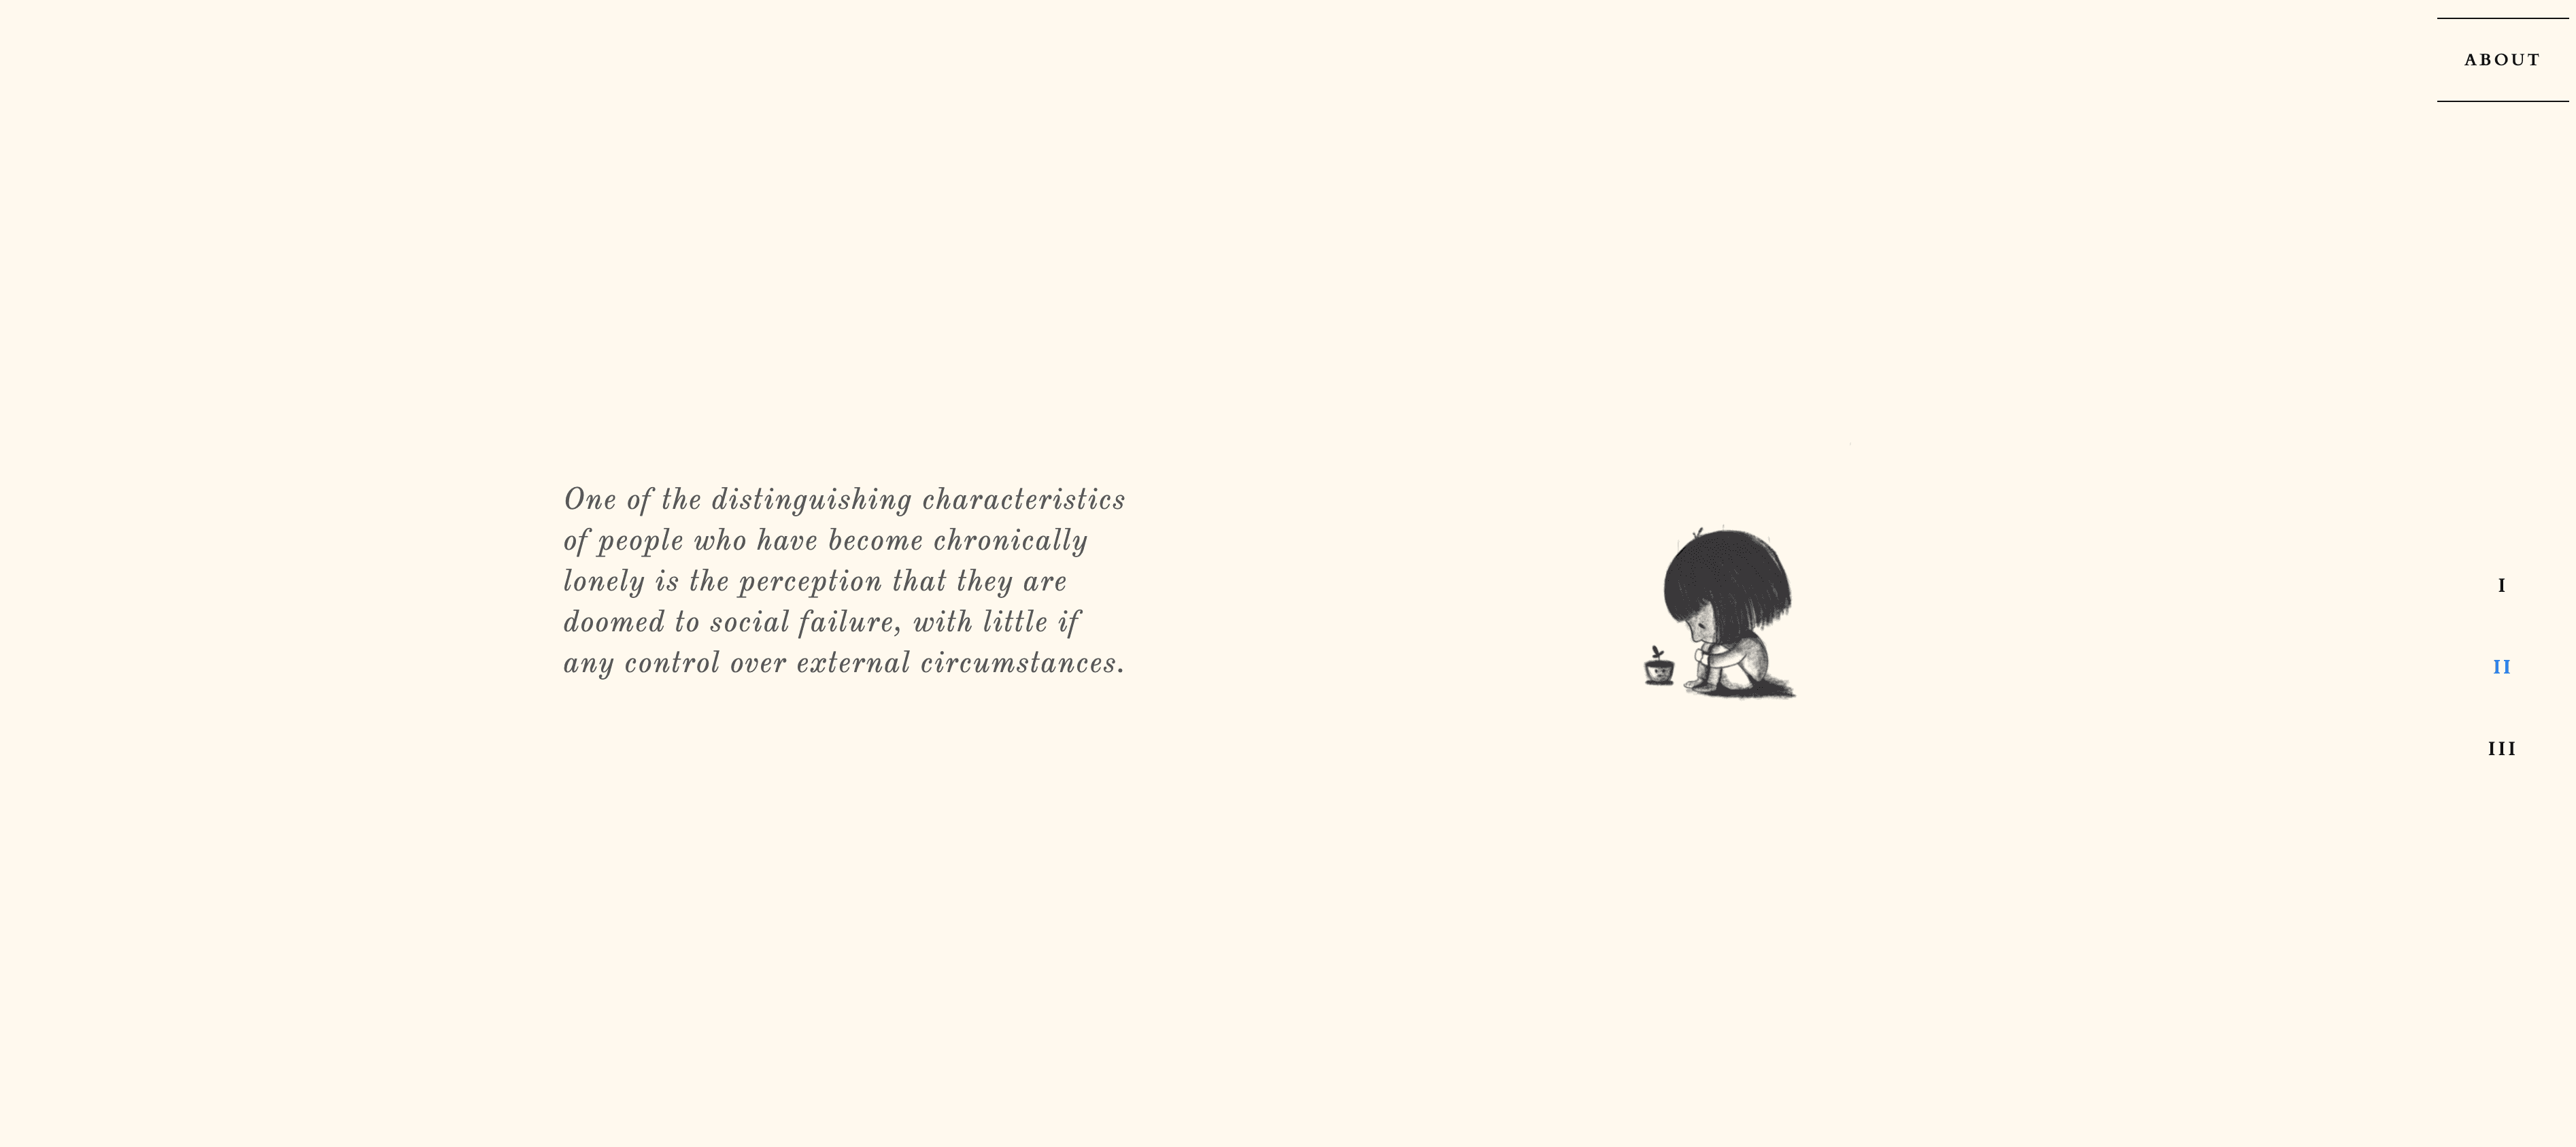
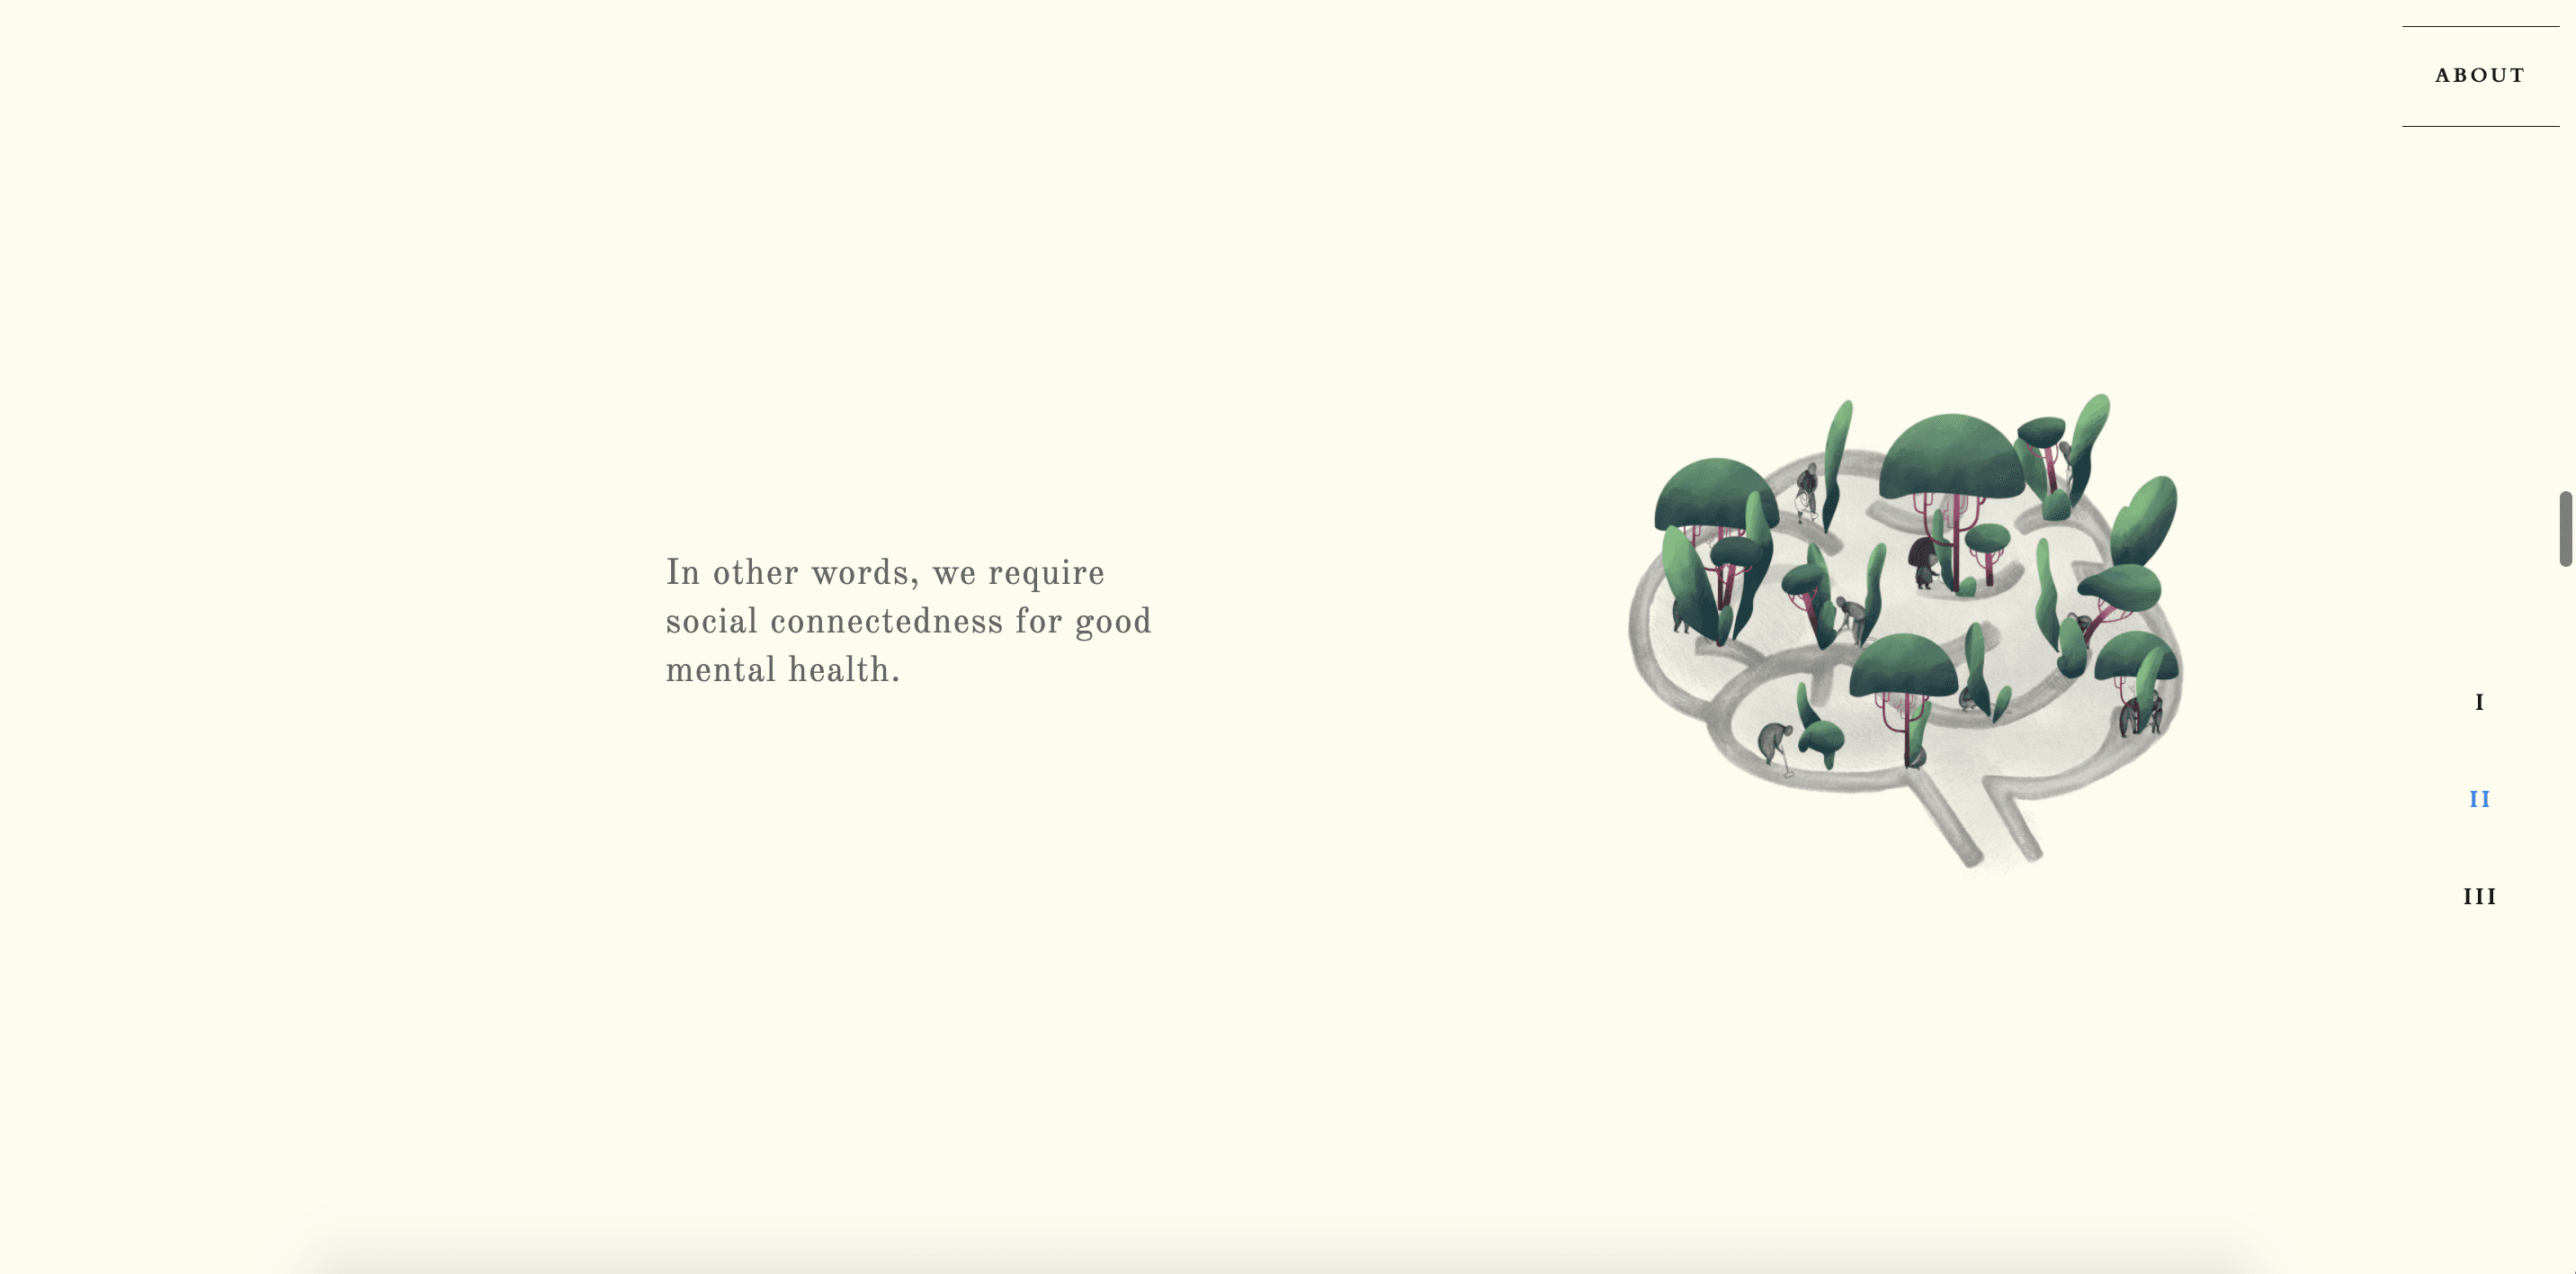
The process began by distilling complex research on brain science and loneliness into simple, engaging storylines through script editing and storyboarding. Children's book-style illustrations were created and animated with Lottie files, syncing with interactive scrolling text to form dual narratives. GIFs highlighted key data points, linking science to real-world impact.
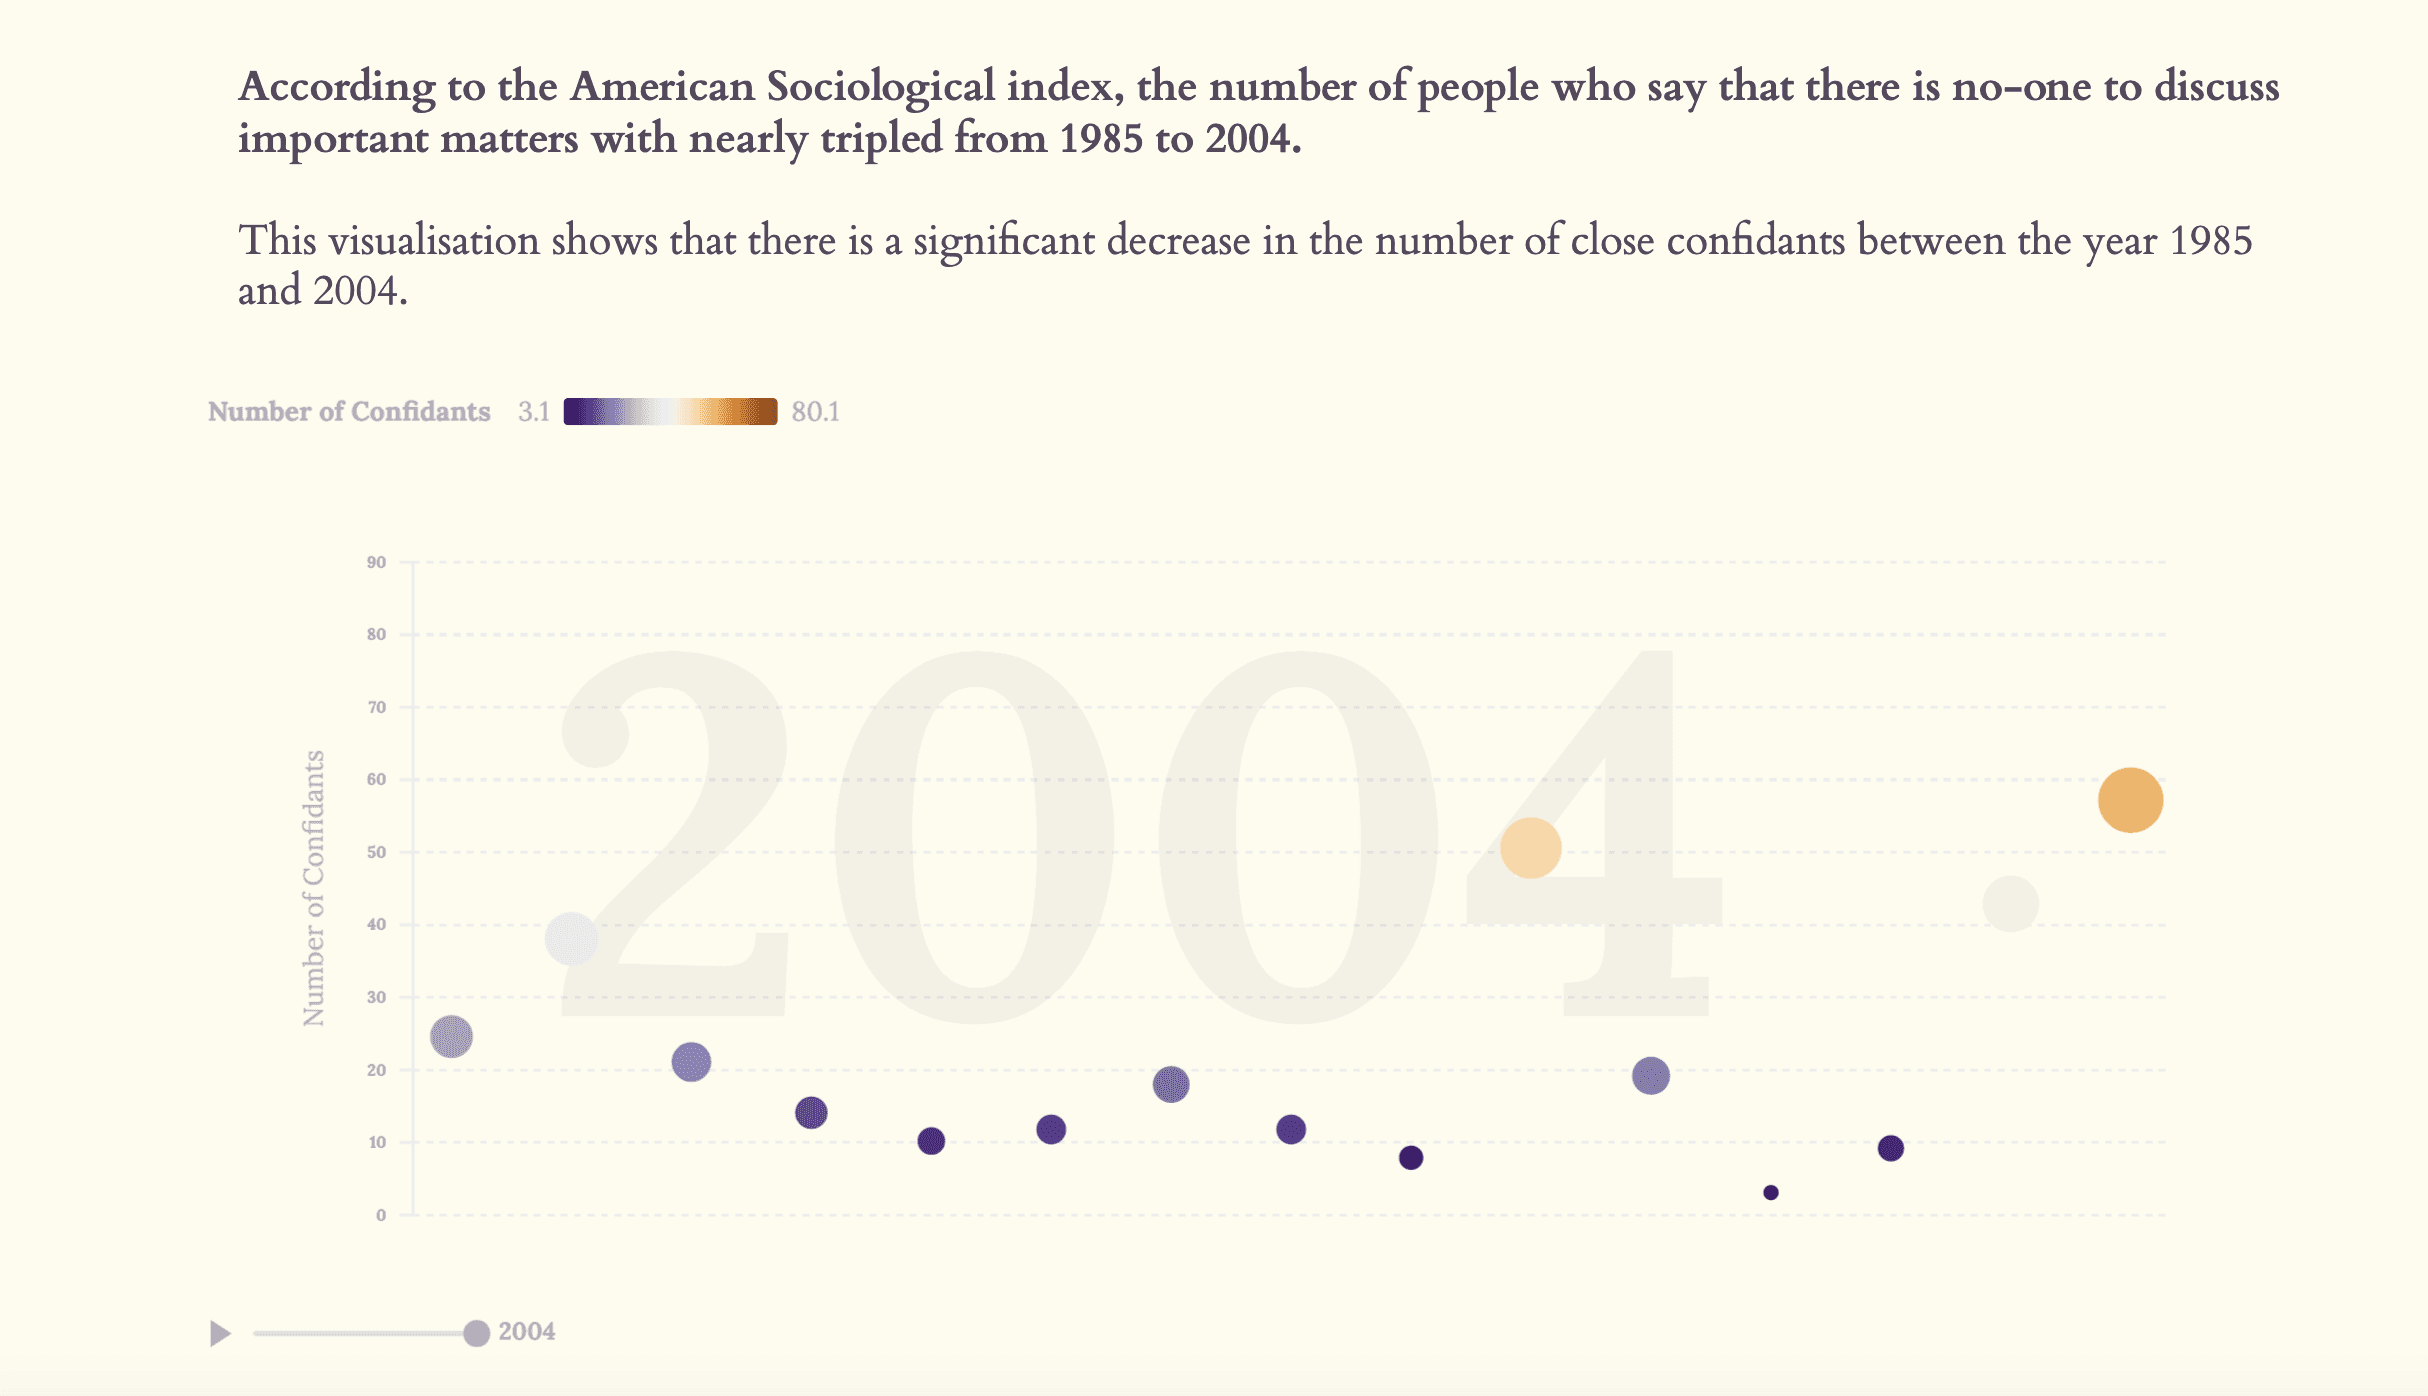
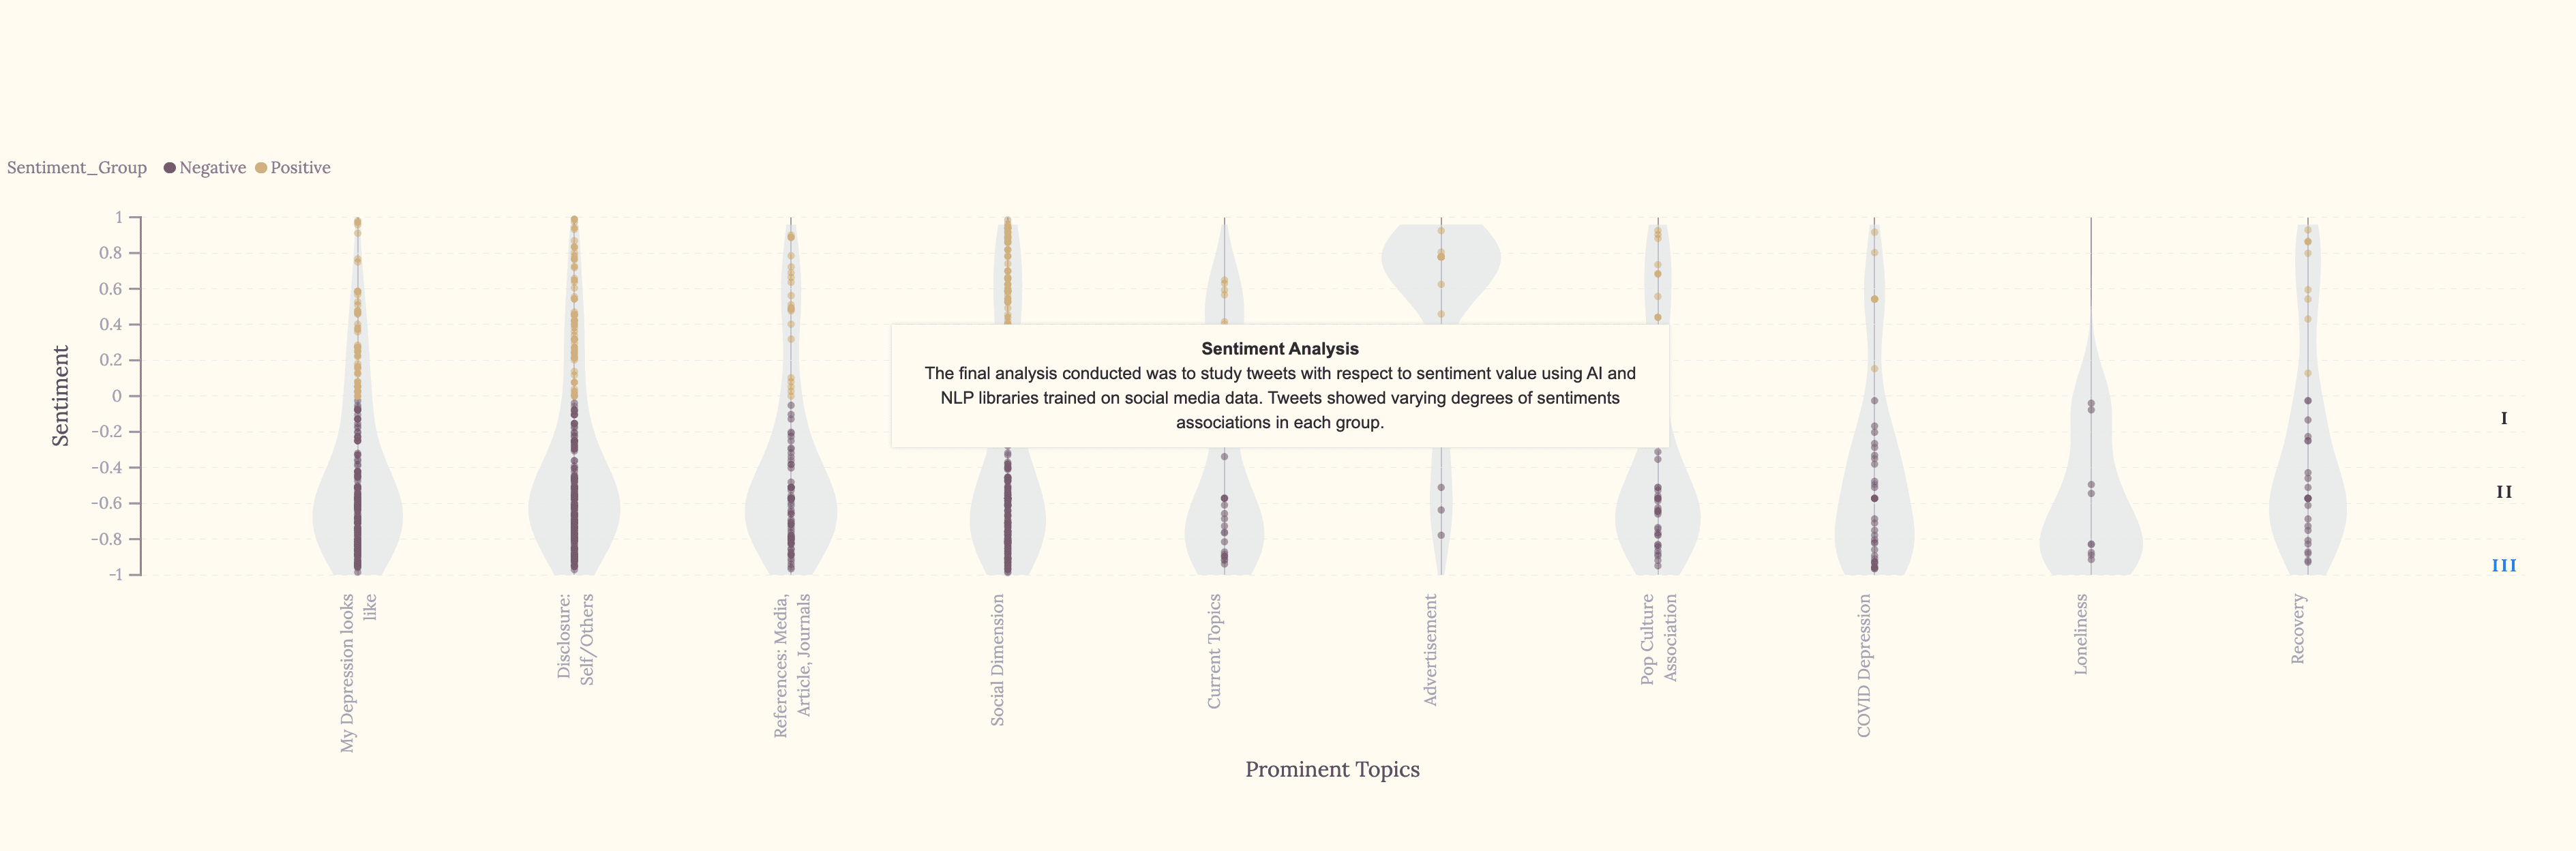
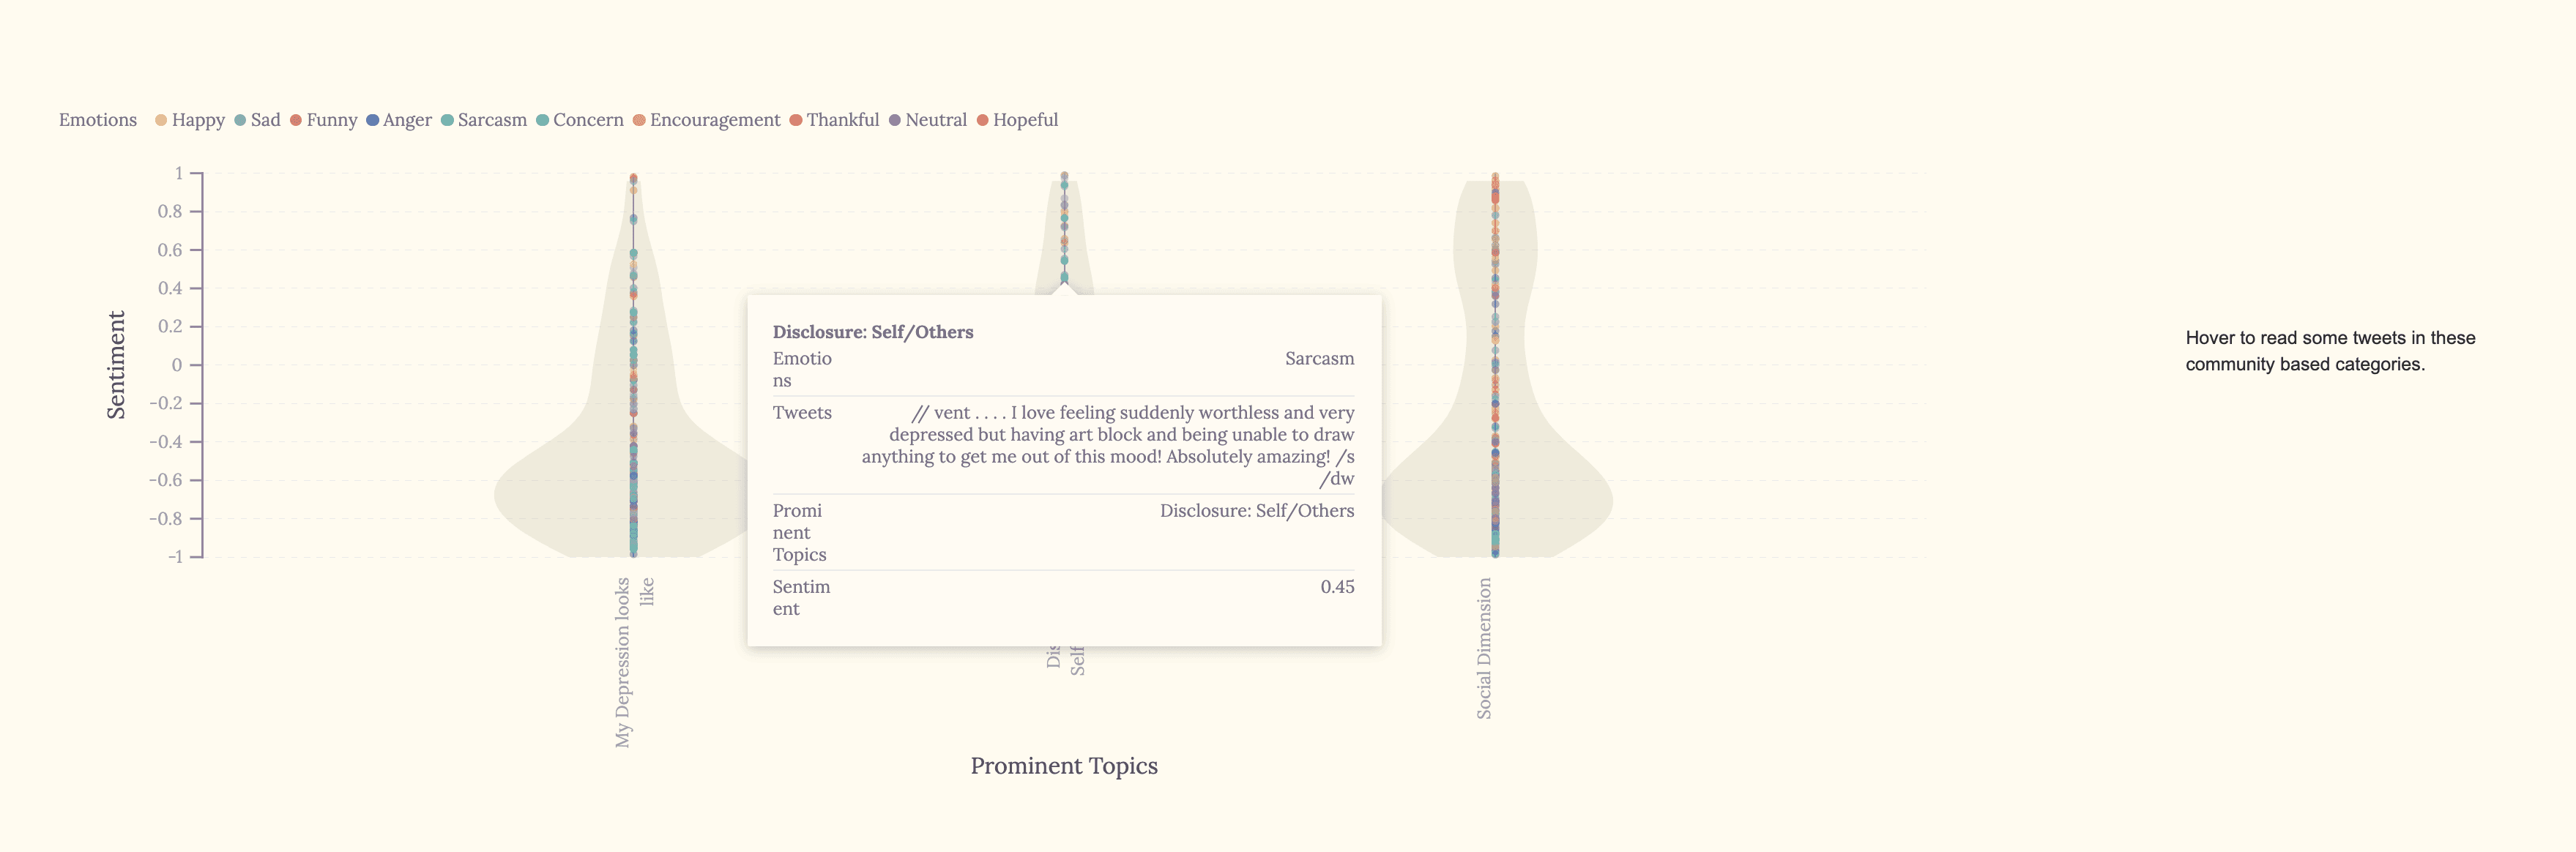
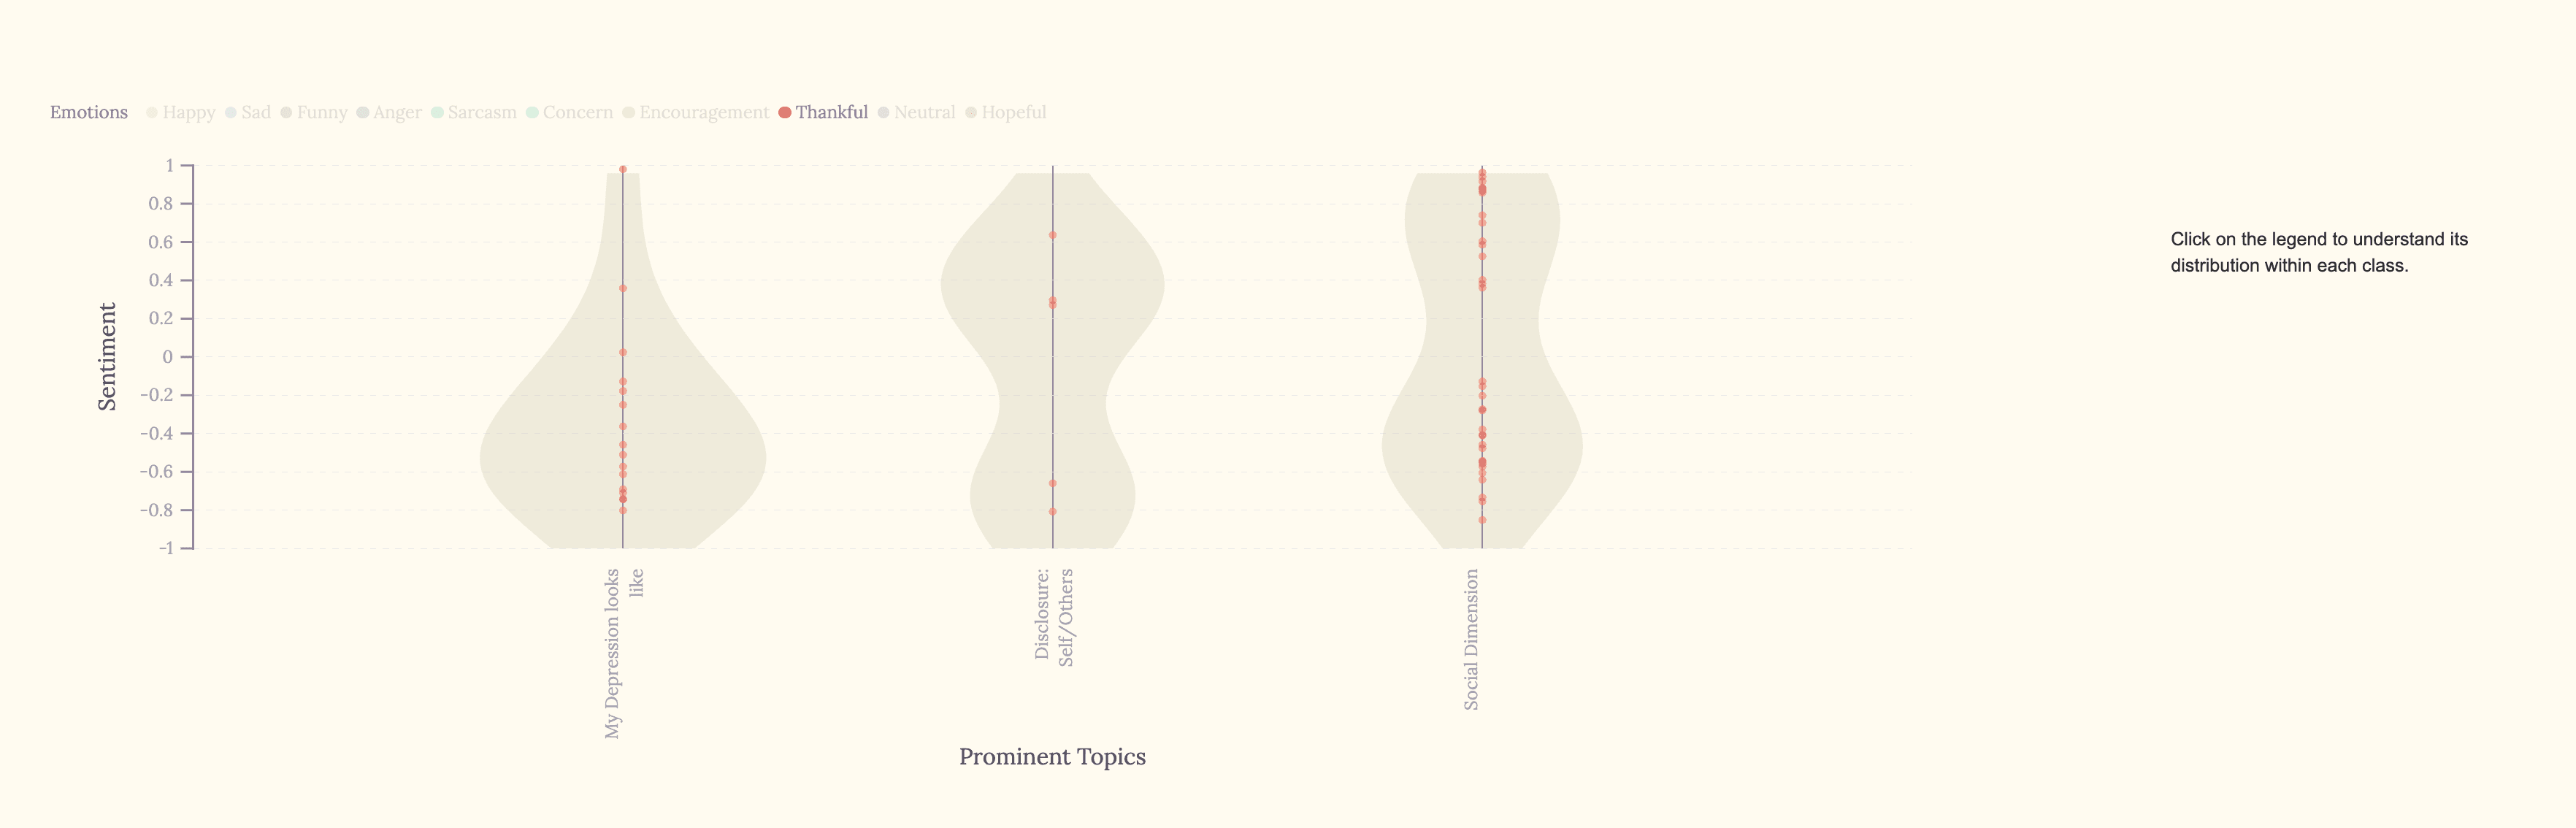
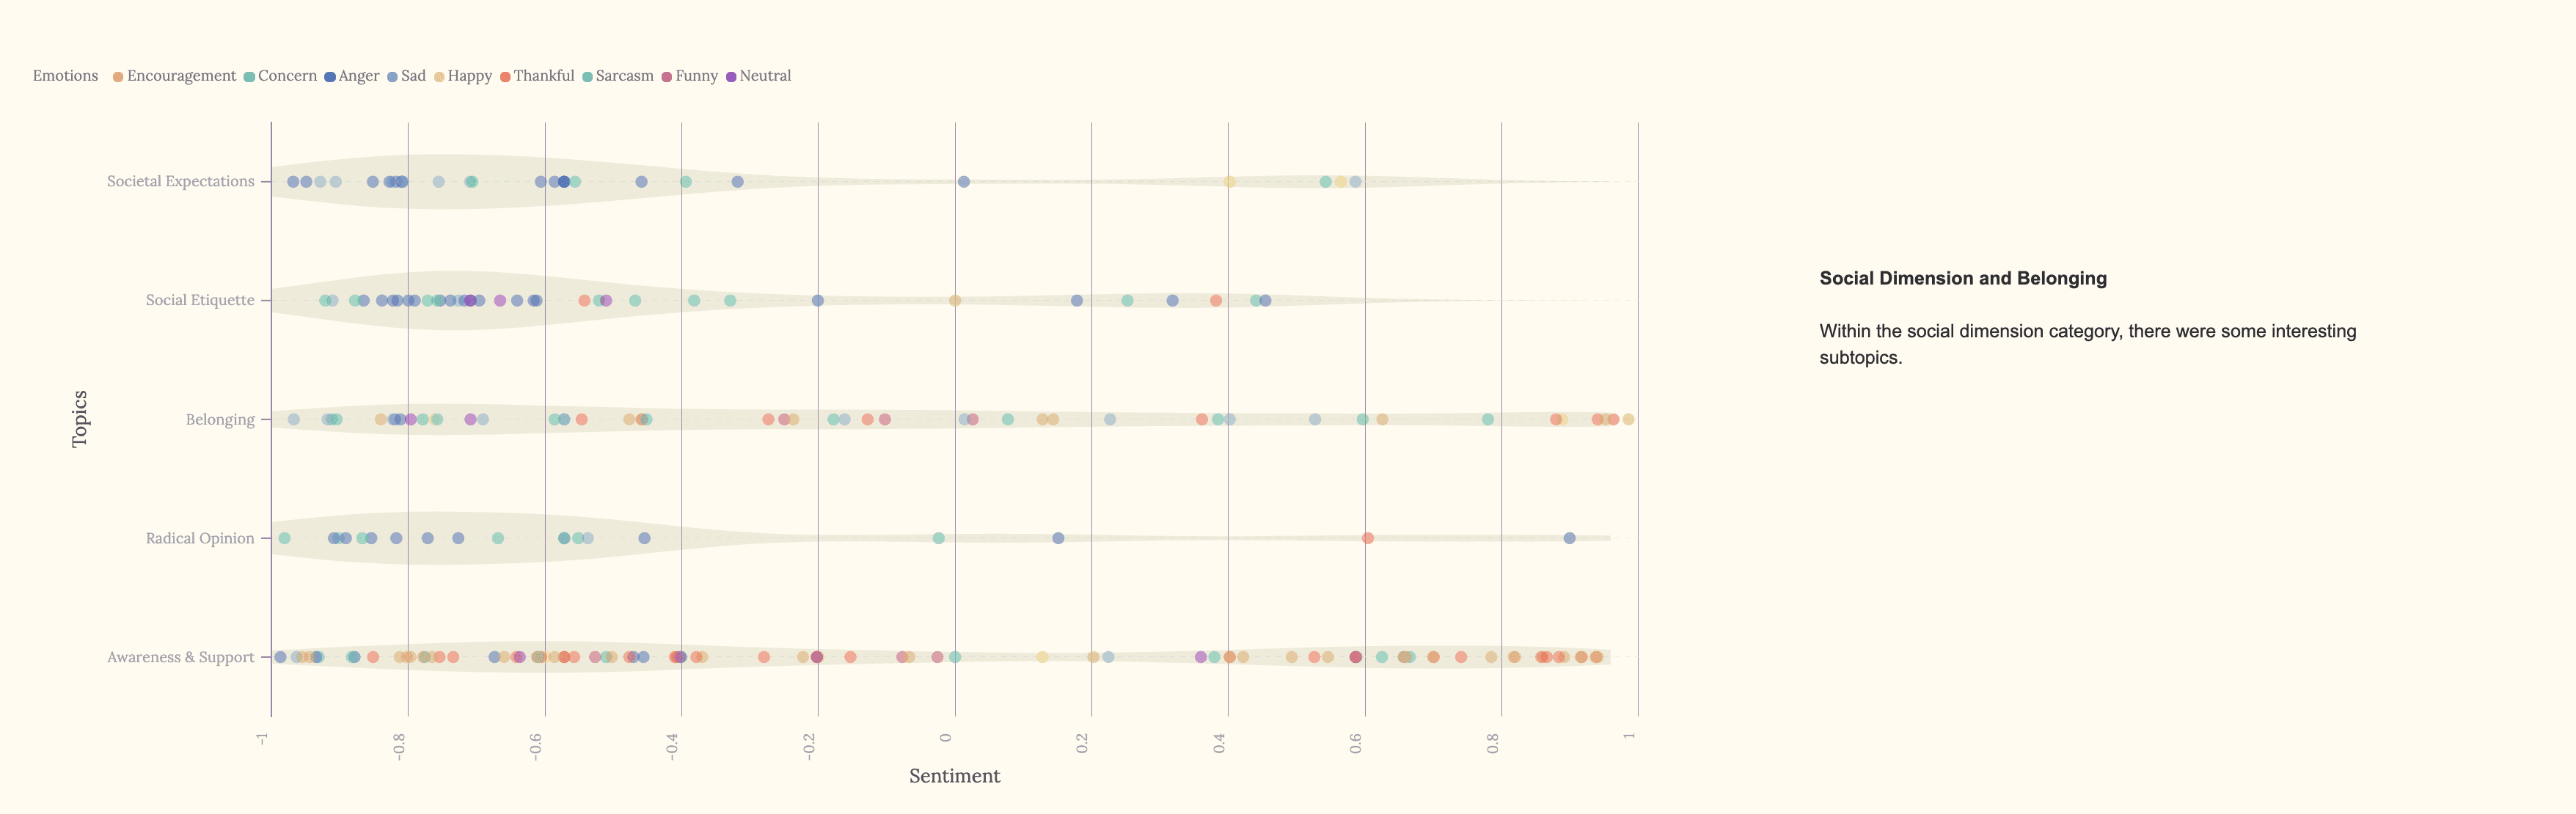
Collaboration with Penn State IST students involved using NLP to analyze over 1,000 tweets on #depression and #mentalhealth, revealing patterns like late-night emotional peaks and sarcastic tones. Flourish visualizations brought the data to life with interactive hovers and filters, allowing dynamic exploration of sentiments, subtopics, and the human stories behind the data.
The process began by distilling complex research on brain science and loneliness into simple, engaging storylines through script editing and storyboarding. Children's book-style illustrations were created and animated with Lottie files, syncing with interactive scrolling text to form dual narratives. GIFs highlighted key data points, linking science to real-world impact.
Collaboration with Penn State IST students involved using NLP to analyze over 1,000 tweets on #depression and #mentalhealth, revealing patterns like late-night emotional peaks and sarcastic tones. Flourish visualizations brought the data to life with interactive hovers and filters, allowing dynamic exploration of sentiments, subtopics, and the human stories behind the data.
Component 1 - Data Analytics from Literature


Component 2 - Data Analytics from Literature

Component 2 - Tweet Analysis and Data Visualisation


Bloom
Project Overview
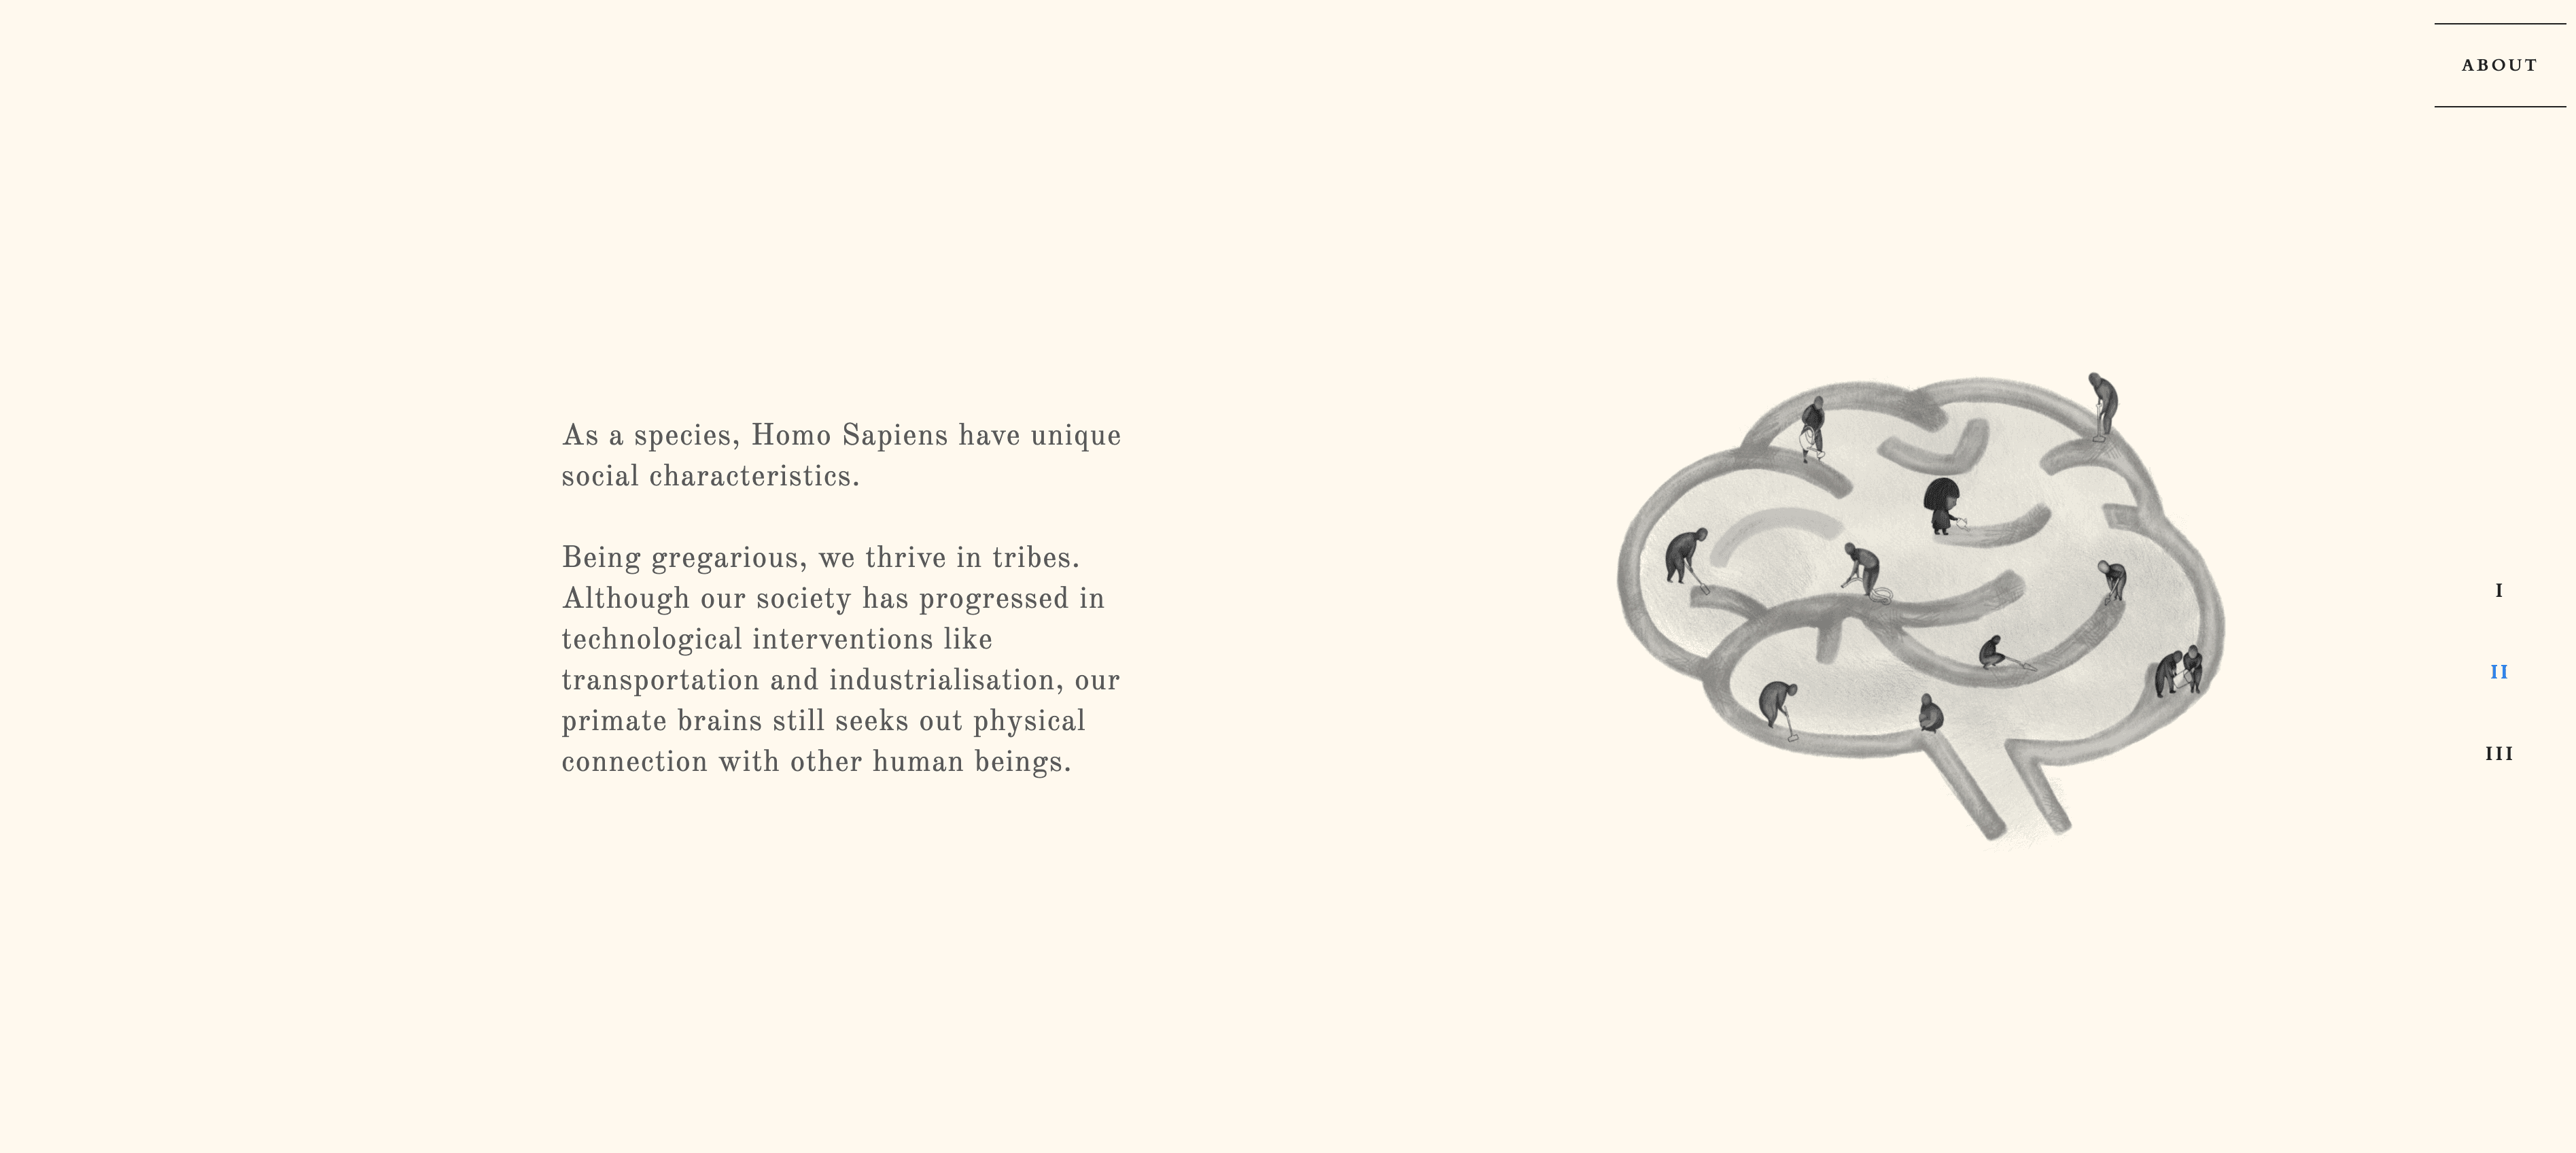
This project blends scientific and social perspectives to explore how modern life, industrialization, and the pandemic have weakened community ties, exacerbating mental health struggles. It uses conceptual illustrations and tweet analysis to visualize how these issues appear in daily conversations, highlighting the critical concern of loneliness today.
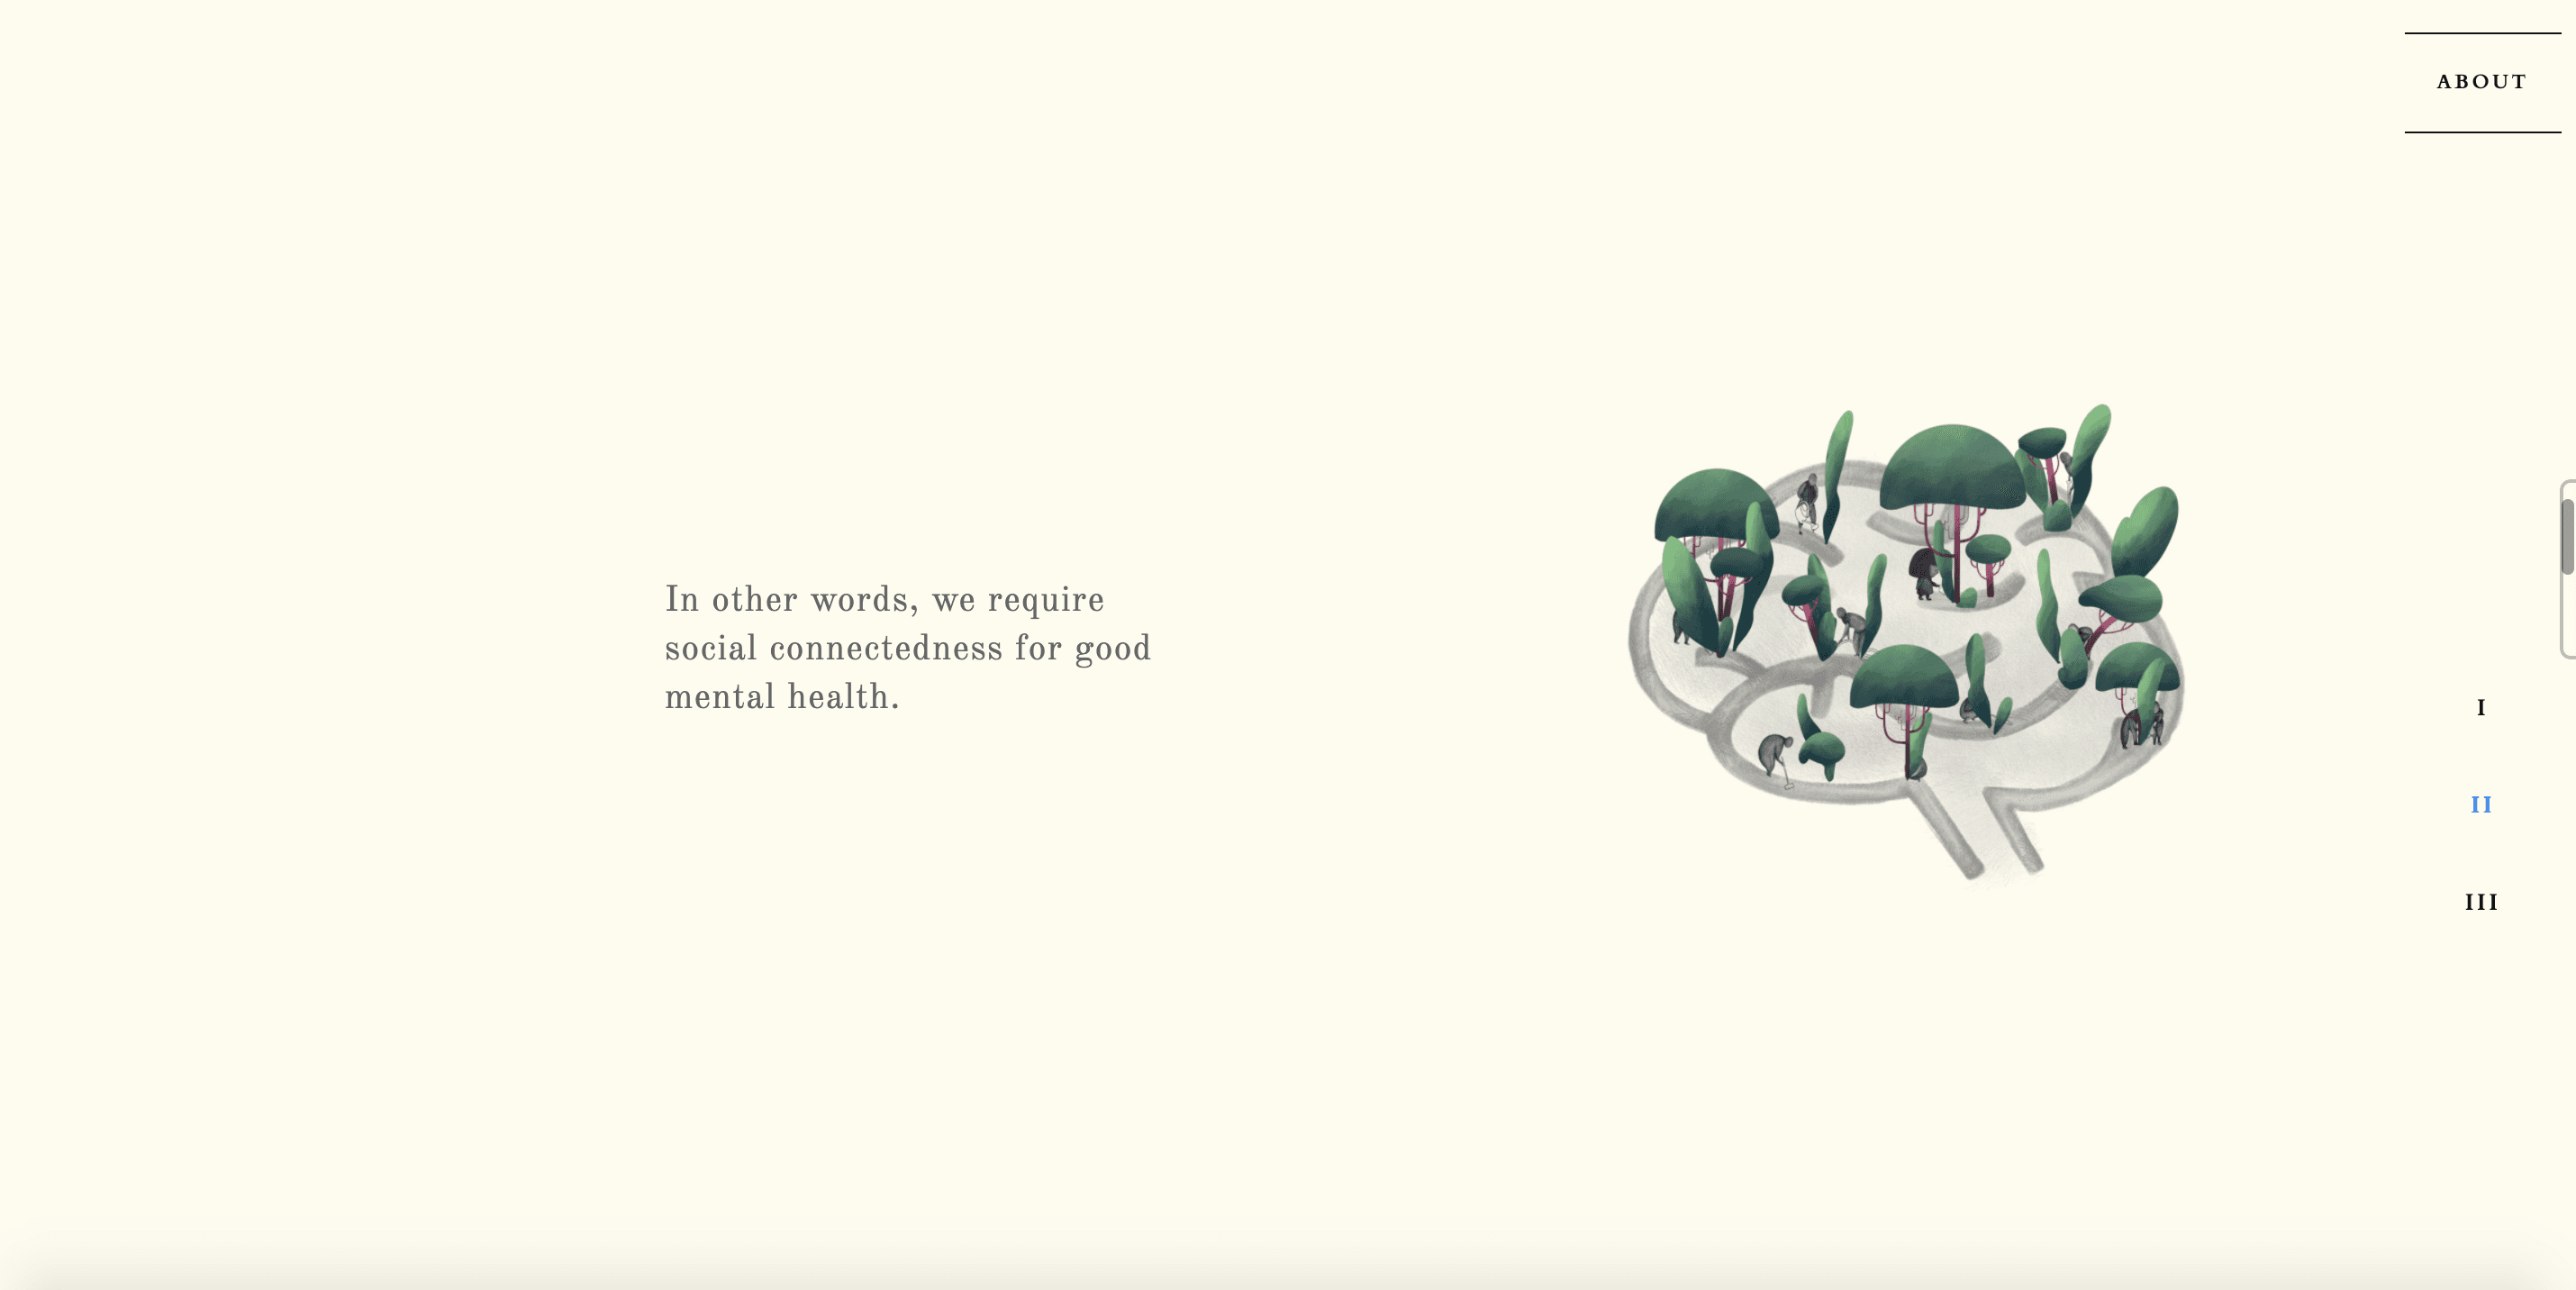
The project addresses loneliness by breaking it into digestible components within a unified UI framework. Interactive scrolling and data visualization make complex insights accessible, guiding users smoothly through the content while maintaining depth and engagement.
This project blends scientific and social perspectives to explore how modern life, industrialization, and the pandemic have weakened community ties, exacerbating mental health struggles. It uses conceptual illustrations and tweet analysis to visualize how these issues appear in daily conversations, highlighting the critical concern of loneliness today.
The project addresses loneliness by breaking it into digestible components within a unified UI framework. Interactive scrolling and data visualization make complex insights accessible, guiding users smoothly through the content while maintaining depth and engagement.
Components
Data Analytics from Literature
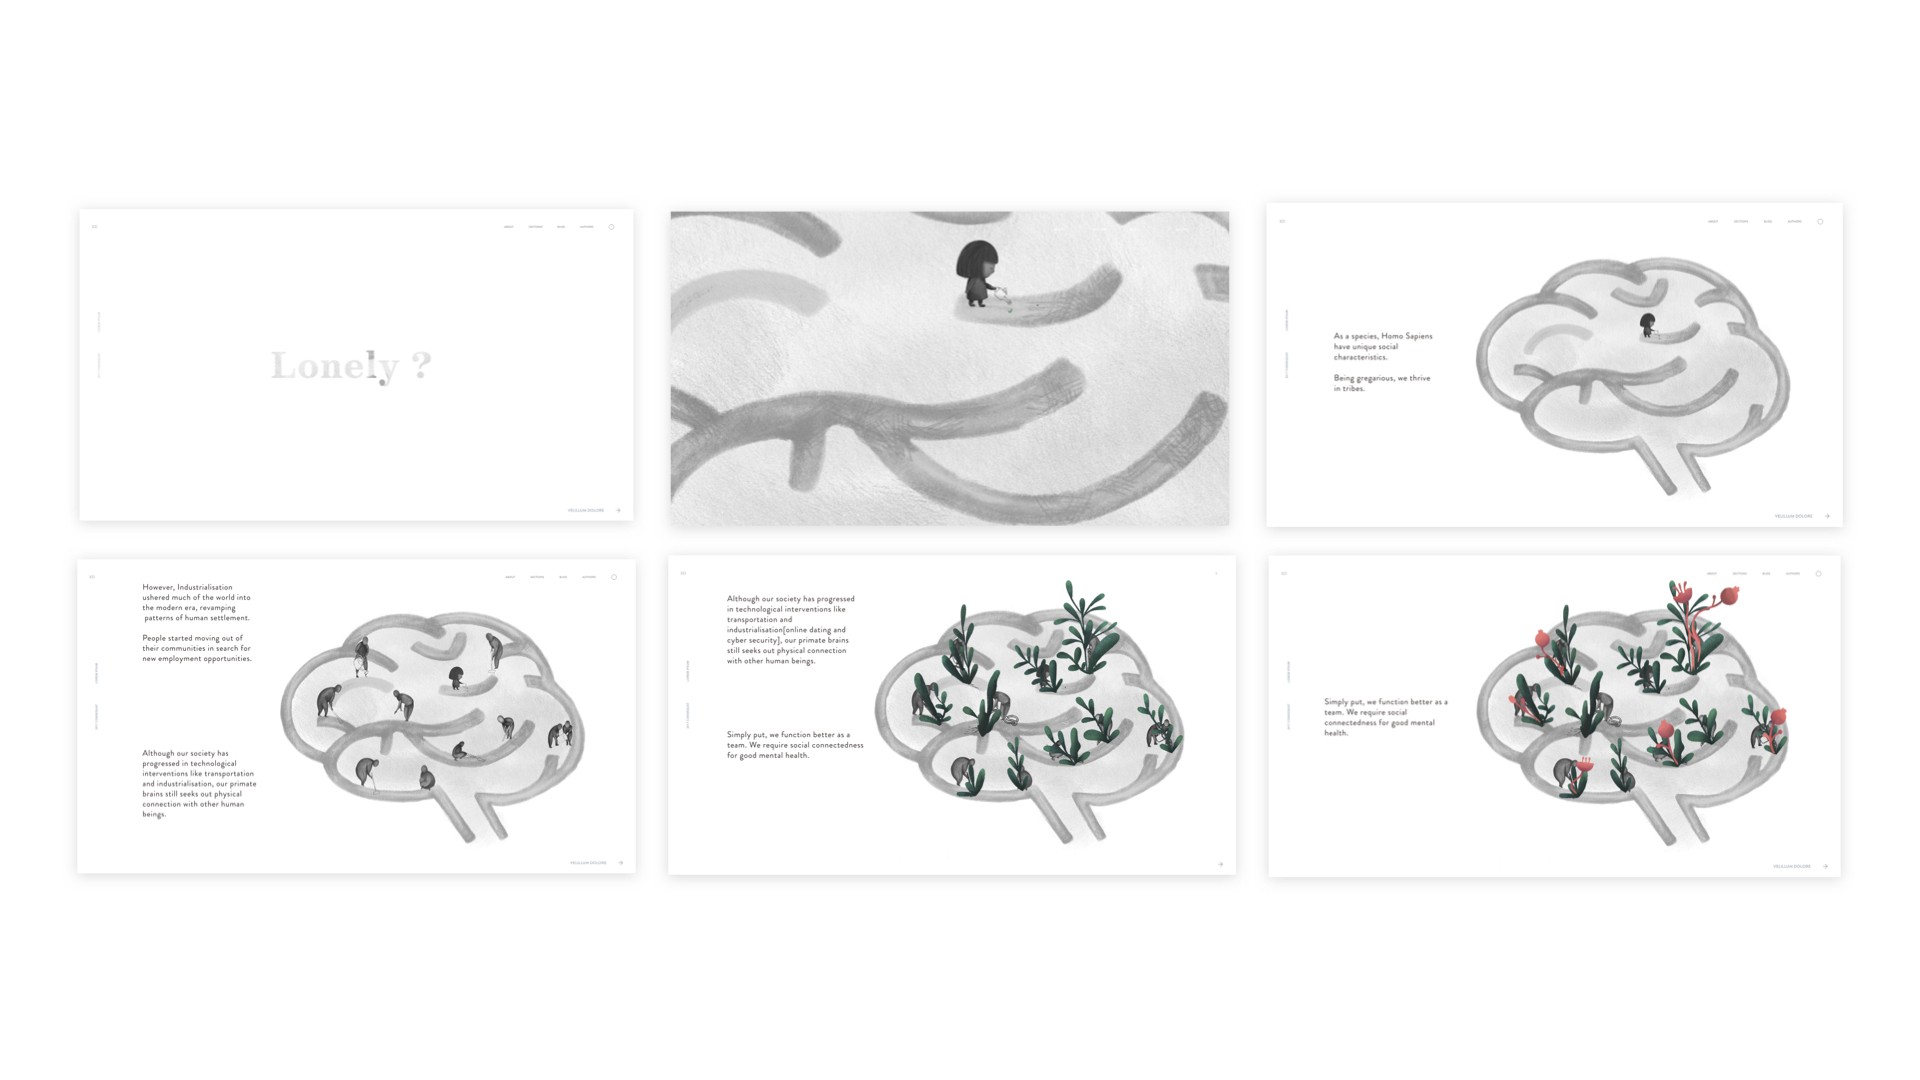
Simplifies brain science on loneliness with children's book-style illustrations and GIFs for clarity and relevance. Uses interactive scrolling and Lottie animations to explore loneliness, creating a dual narrative impact.
Tweet Analysis Data Visualization
Analyzes 1,000+ tweets on #depression using NLP, visualized in Flourish to reveal emotional patterns and insights.
Ultimately, this project views data as a storyteller—one capable of sparking meaningful conversations about urgent environmental issues.
Using datasets from Penn State’s Centre for Pollination Research, I examined rising temperatures, shifting species patterns, and increasing pollutants to uncover links between air quality, climate change, and respiratory health.
Spreading