Spreading
Year
'21
Client
Graduate Project
Service
Data Visualisation
Process
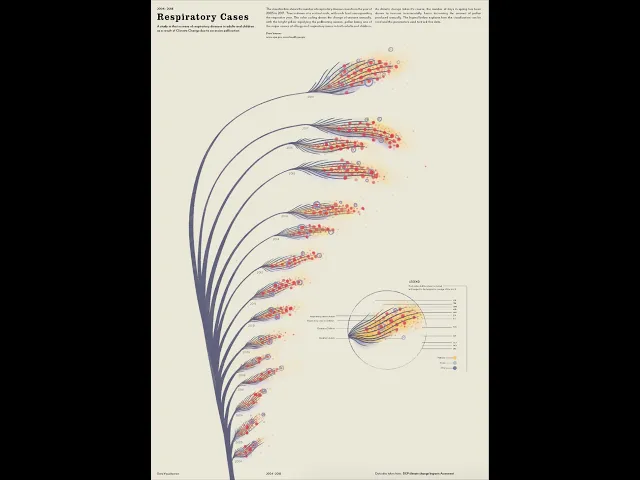
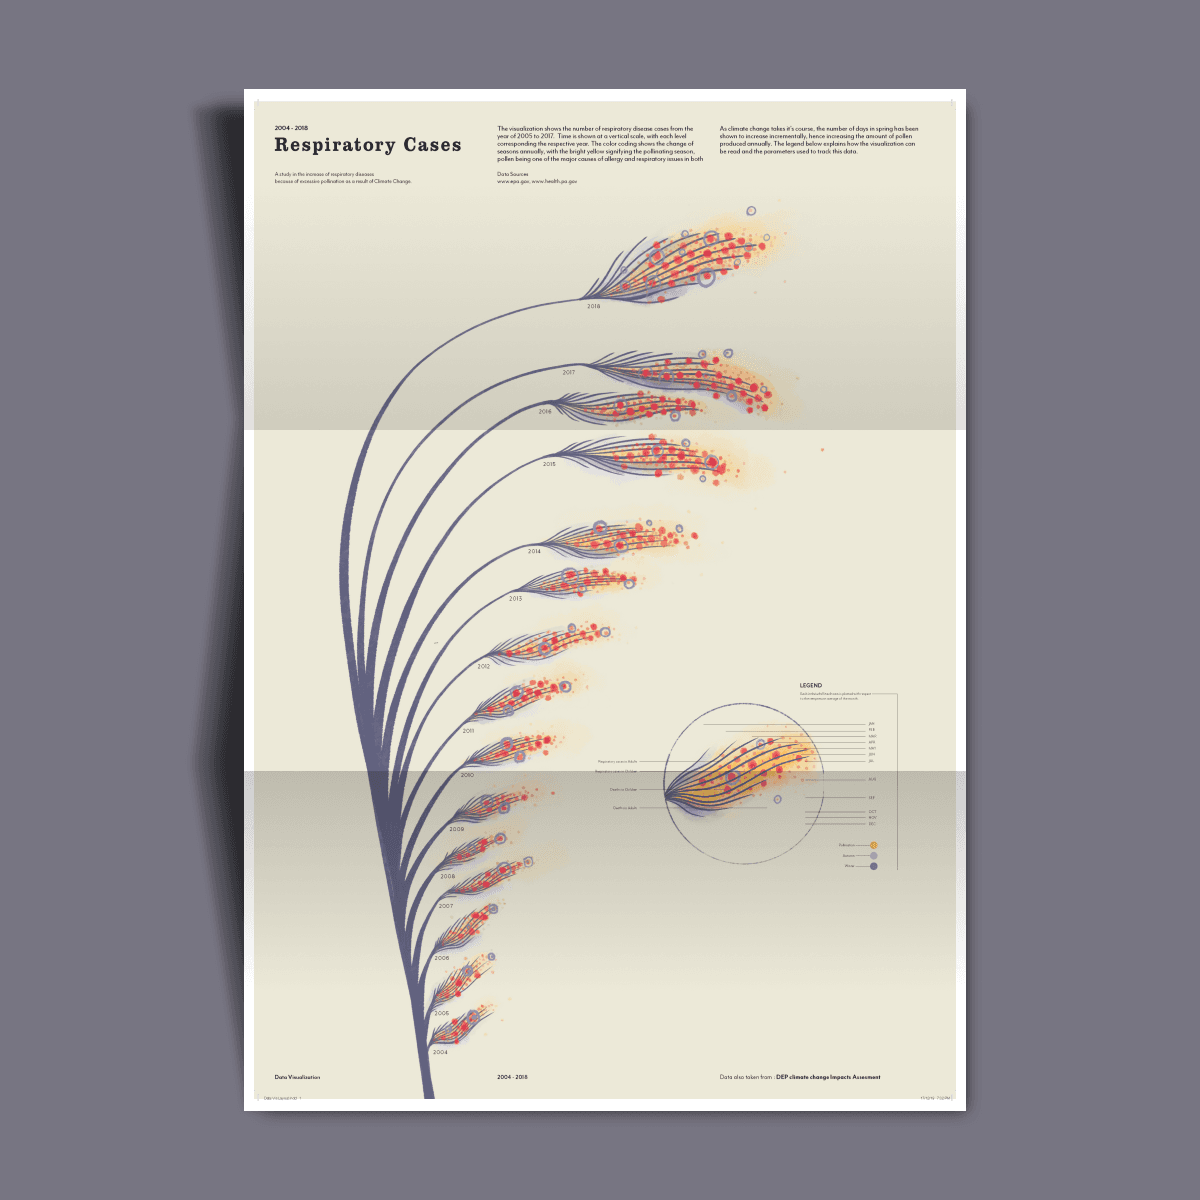
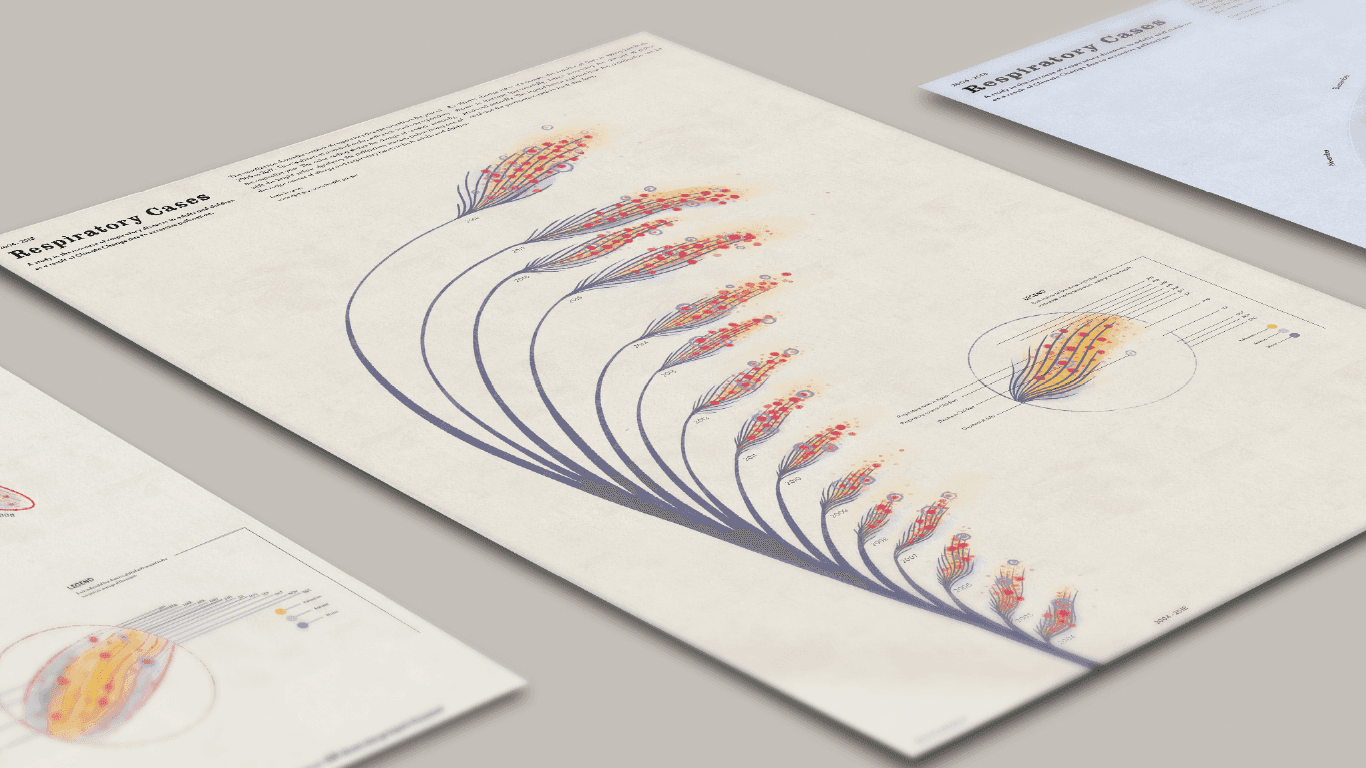
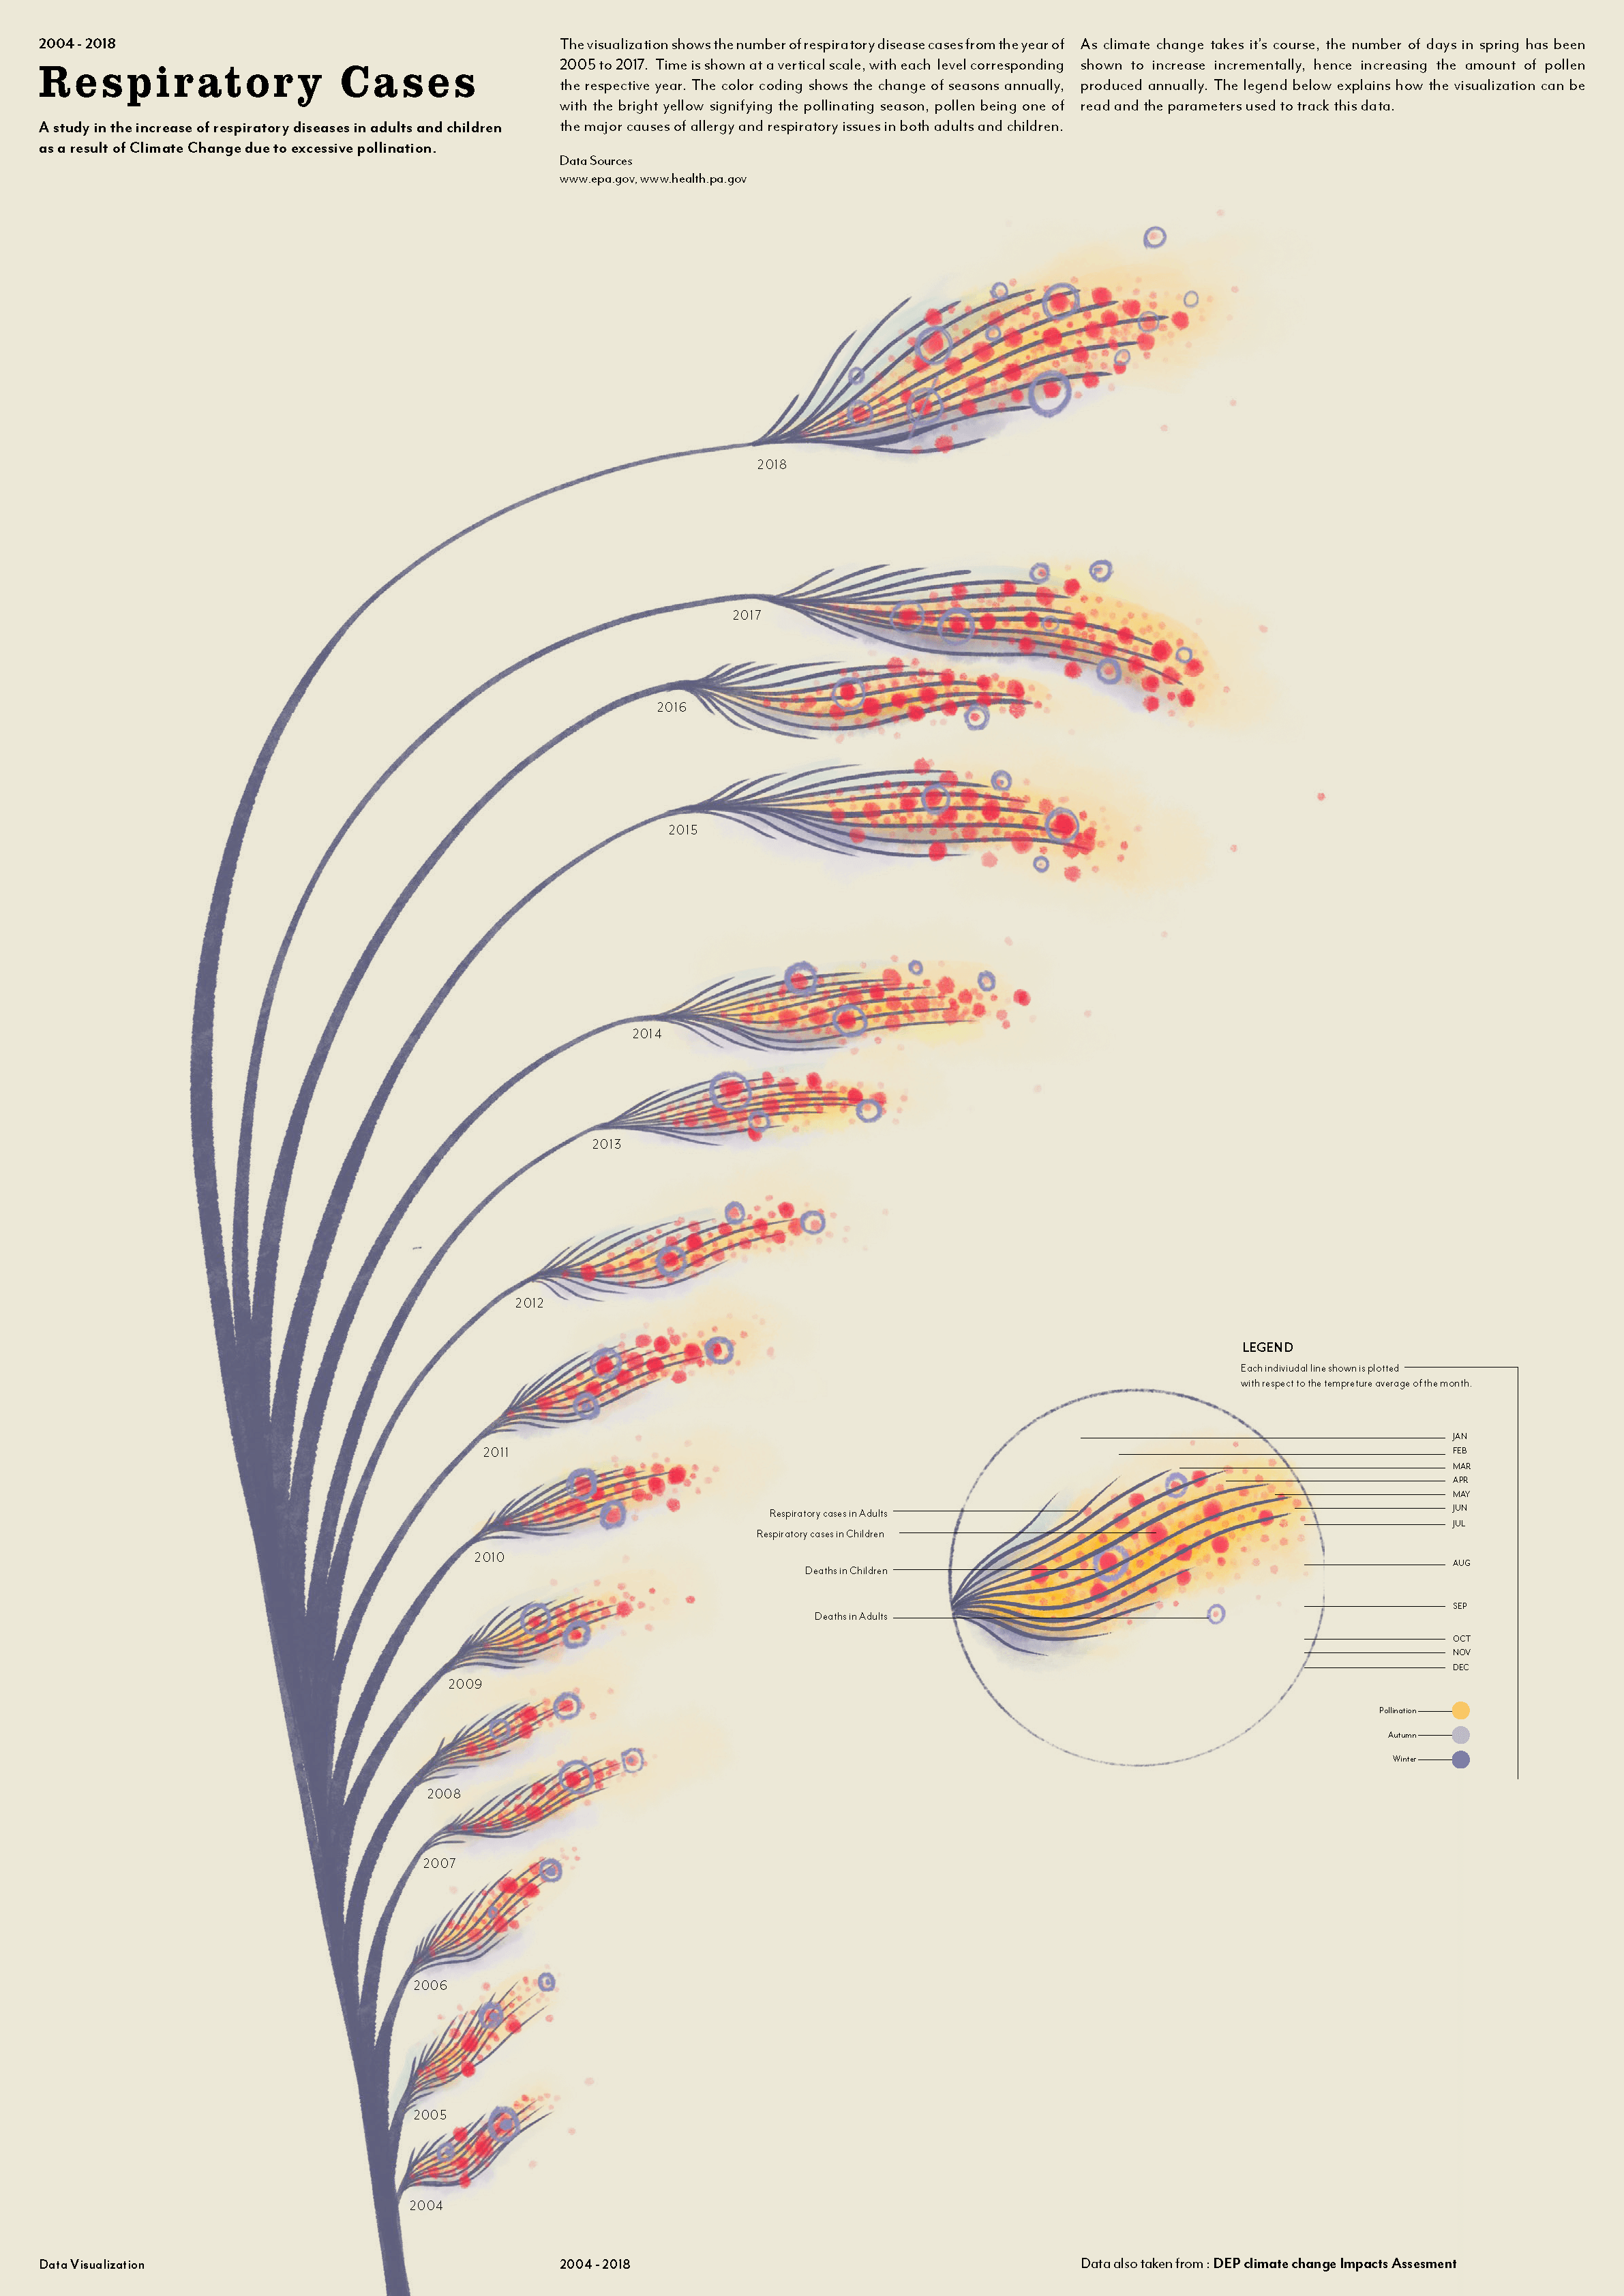
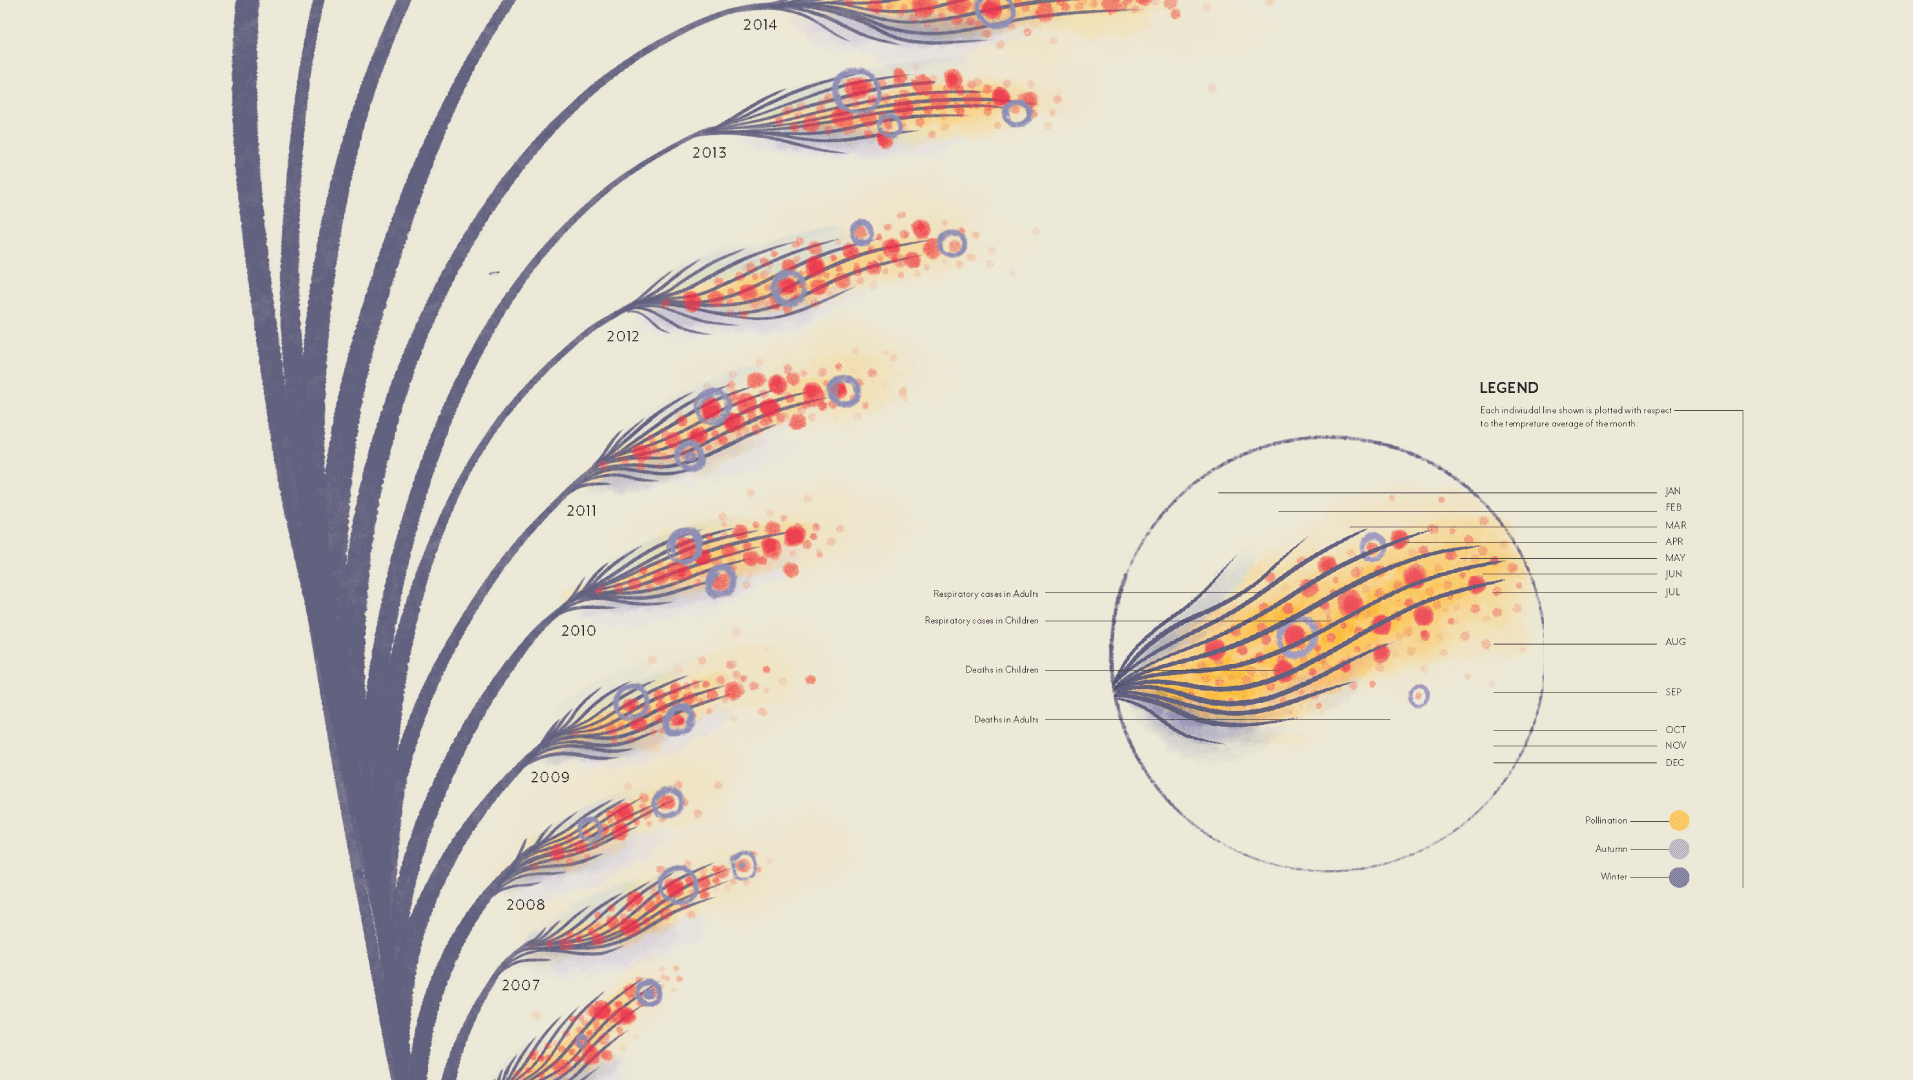
During sketching and prototyping, I tested multiple visual iterations to balance clarity and emotional resonance. Final visuals combined hand-plotted elements with digital composition to retain a tactile, human quality. Pastel yellows represented pollen levels, while red accents denoted mortality linked to respiratory issues.


Final Prototypes

Bloom